IBTrACS#
This tutorial explores the International Best Track Archive for Climate Stewardship (IBTrACS) dataset, which provides global tropical cyclone data. The dataset is available in multiple formats, including CSV, shapefiles, and NetCDF, which we will explore in this notebook.
We will cover the following:
How to load and analyze IBTrACS data in CSV format.
How to work with shapefiles to visualize cyclone paths.
How to leverage the NetCDF format for more advanced analyses.
import pandas as pd
from IPython.display import display
import folium
import matplotlib.pyplot as plt
import numpy as np
import geopandas as gpd
import requests
import zipfile
CSV Data#
In this section, we will load IBTrACS data in CSV format. The CSV format is straightforward and ideal for those who are familiar with tabular data. We will explore basic operations, such as loading the data into a DataFrame, filtering specific columns, and performing simple analyses.
Steps:#
Load the CSV file using Pandas.
Inspect the data to understand its structure and content.
Filter and analyze specific columns, such as storm names, dates, and locations.
#point to IBTrACS URL
url = "https://www.ncei.noaa.gov/data/international-best-track-archive-for-climate-stewardship-ibtracs/v04r01/access/csv/ibtracs.ALL.list.v04r01.csv"
#Load the IBTrACS CSV data into a DataFrame and display the first few rows to get an overview of the data.
ibtracs_data = pd.read_csv(url)

ibtracs_data.head()
/tmp/ipykernel_2119/2281934979.py:2: DtypeWarning: Columns (1,2,8,9,14,19,20,172,173) have mixed types. Specify dtype option on import or set low_memory=False.
  ibtracs_data = pd.read_csv(url)
| SID | SEASON | NUMBER | BASIN | SUBBASIN | NAME | ISO_TIME | NATURE | LAT | LON | ... | BOM_GUST_PER | REUNION_GUST | REUNION_GUST_PER | USA_SEAHGT | USA_SEARAD_NE | USA_SEARAD_SE | USA_SEARAD_SW | USA_SEARAD_NW | STORM_SPEED | STORM_DIR | |
|---|---|---|---|---|---|---|---|---|---|---|---|---|---|---|---|---|---|---|---|---|---|
| 0 | Year | degrees_north | degrees_east | ... | second | kts | second | ft | nmile | nmile | nmile | nmile | kts | degrees | |||||||
| 1 | 1842298N11080 | 1842 | 1 | NI | BB | UNNAMED | 1842-10-25 03:00:00 | NR | 10.9 | 80.3 | ... | 9 | 265 | ||||||||
| 2 | 1842298N11080 | 1842 | 1 | NI | BB | UNNAMED | 1842-10-25 06:00:00 | NR | 10.9 | 79.8 | ... | 9 | 265 | ||||||||
| 3 | 1842298N11080 | 1842 | 1 | NI | BB | UNNAMED | 1842-10-25 09:00:00 | NR | 10.8 | 79.4 | ... | 9 | 265 | ||||||||
| 4 | 1842298N11080 | 1842 | 1 | NI | BB | UNNAMED | 1842-10-25 12:00:00 | NR | 10.8 | 78.9 | ... | 9 | 265 |
5 rows × 174 columns
Exploring the Data#
Before diving deeper, let’s explore the structure of the dataset. We’ll start by listing all the column names to understand what data is available.
#create a list of columns to a list
column_list = ibtracs_data.columns.tolist()
print(column_list)
['SID', 'SEASON', 'NUMBER', 'BASIN', 'SUBBASIN', 'NAME', 'ISO_TIME', 'NATURE', 'LAT', 'LON', 'WMO_WIND', 'WMO_PRES', 'WMO_AGENCY', 'TRACK_TYPE', 'DIST2LAND', 'LANDFALL', 'IFLAG', 'USA_AGENCY', 'USA_ATCF_ID', 'USA_LAT', 'USA_LON', 'USA_RECORD', 'USA_STATUS', 'USA_WIND', 'USA_PRES', 'USA_SSHS', 'USA_R34_NE', 'USA_R34_SE', 'USA_R34_SW', 'USA_R34_NW', 'USA_R50_NE', 'USA_R50_SE', 'USA_R50_SW', 'USA_R50_NW', 'USA_R64_NE', 'USA_R64_SE', 'USA_R64_SW', 'USA_R64_NW', 'USA_POCI', 'USA_ROCI', 'USA_RMW', 'USA_EYE', 'TOKYO_LAT', 'TOKYO_LON', 'TOKYO_GRADE', 'TOKYO_WIND', 'TOKYO_PRES', 'TOKYO_R50_DIR', 'TOKYO_R50_LONG', 'TOKYO_R50_SHORT', 'TOKYO_R30_DIR', 'TOKYO_R30_LONG', 'TOKYO_R30_SHORT', 'TOKYO_LAND', 'CMA_LAT', 'CMA_LON', 'CMA_CAT', 'CMA_WIND', 'CMA_PRES', 'HKO_LAT', 'HKO_LON', 'HKO_CAT', 'HKO_WIND', 'HKO_PRES', 'KMA_LAT', 'KMA_LON', 'KMA_CAT', 'KMA_WIND', 'KMA_PRES', 'KMA_R50_DIR', 'KMA_R50_LONG', 'KMA_R50_SHORT', 'KMA_R30_DIR', 'KMA_R30_LONG', 'KMA_R30_SHORT', 'NEWDELHI_LAT', 'NEWDELHI_LON', 'NEWDELHI_GRADE', 'NEWDELHI_WIND', 'NEWDELHI_PRES', 'NEWDELHI_CI', 'NEWDELHI_DP', 'NEWDELHI_POCI', 'REUNION_LAT', 'REUNION_LON', 'REUNION_TYPE', 'REUNION_WIND', 'REUNION_PRES', 'REUNION_TNUM', 'REUNION_CI', 'REUNION_RMW', 'REUNION_R34_NE', 'REUNION_R34_SE', 'REUNION_R34_SW', 'REUNION_R34_NW', 'REUNION_R50_NE', 'REUNION_R50_SE', 'REUNION_R50_SW', 'REUNION_R50_NW', 'REUNION_R64_NE', 'REUNION_R64_SE', 'REUNION_R64_SW', 'REUNION_R64_NW', 'BOM_LAT', 'BOM_LON', 'BOM_TYPE', 'BOM_WIND', 'BOM_PRES', 'BOM_TNUM', 'BOM_CI', 'BOM_RMW', 'BOM_R34_NE', 'BOM_R34_SE', 'BOM_R34_SW', 'BOM_R34_NW', 'BOM_R50_NE', 'BOM_R50_SE', 'BOM_R50_SW', 'BOM_R50_NW', 'BOM_R64_NE', 'BOM_R64_SE', 'BOM_R64_SW', 'BOM_R64_NW', 'BOM_ROCI', 'BOM_POCI', 'BOM_EYE', 'BOM_POS_METHOD', 'BOM_PRES_METHOD', 'NADI_LAT', 'NADI_LON', 'NADI_CAT', 'NADI_WIND', 'NADI_PRES', 'WELLINGTON_LAT', 'WELLINGTON_LON', 'WELLINGTON_WIND', 'WELLINGTON_PRES', 'DS824_LAT', 'DS824_LON', 'DS824_STAGE', 'DS824_WIND', 'DS824_PRES', 'TD9636_LAT', 'TD9636_LON', 'TD9636_STAGE', 'TD9636_WIND', 'TD9636_PRES', 'TD9635_LAT', 'TD9635_LON', 'TD9635_WIND', 'TD9635_PRES', 'TD9635_ROCI', 'NEUMANN_LAT', 'NEUMANN_LON', 'NEUMANN_CLASS', 'NEUMANN_WIND', 'NEUMANN_PRES', 'MLC_LAT', 'MLC_LON', 'MLC_CLASS', 'MLC_WIND', 'MLC_PRES', 'USA_GUST', 'BOM_GUST', 'BOM_GUST_PER', 'REUNION_GUST', 'REUNION_GUST_PER', 'USA_SEAHGT', 'USA_SEARAD_NE', 'USA_SEARAD_SE', 'USA_SEARAD_SW', 'USA_SEARAD_NW', 'STORM_SPEED', 'STORM_DIR']
Filtering the Dataset#
In this section, we’ll explore how to filter the dataset based on different criteria, such as a specific season or storm. This can be useful when you want to analyze a subset of the data.
Filtering by Season#
Let’s start by filtering the dataset to include only storms from the 2005 season.
#Often we want to filter this dataset by different criteria. Here we do it by
ibtracs_2005=ibtracs_data[ibtracs_data['SEASON'] == 2005]
ibtracs_2005.head(5)
| SID | SEASON | NUMBER | BASIN | SUBBASIN | NAME | ISO_TIME | NATURE | LAT | LON | ... | BOM_GUST_PER | REUNION_GUST | REUNION_GUST_PER | USA_SEAHGT | USA_SEARAD_NE | USA_SEARAD_SE | USA_SEARAD_SW | USA_SEARAD_NW | STORM_SPEED | STORM_DIR | |
|---|---|---|---|---|---|---|---|---|---|---|---|---|---|---|---|---|---|---|---|---|---|
| 590760 | 2004243S03088 | 2005 | 64 | SI | MM | PHOEBE | 2004-08-30 06:00:00 | TS | -2.8 | 87.7 | ... | 40 | 3 | 160 | |||||||
| 590761 | 2004243S03088 | 2005 | 64 | SI | MM | PHOEBE | 2004-08-30 09:00:00 | TS | -3.0 | 87.8 | ... | 3 | 165 | ||||||||
| 590762 | 2004243S03088 | 2005 | 64 | SI | MM | PHOEBE | 2004-08-30 12:00:00 | TS | -3.1 | 87.8 | ... | 40 | 3 | 175 | |||||||
| 590763 | 2004243S03088 | 2005 | 64 | SI | MM | PHOEBE | 2004-08-30 15:00:00 | TS | -3.2 | 87.8 | ... | 3 | 0 | ||||||||
| 590764 | 2004243S03088 | 2005 | 64 | SI | MM | PHOEBE | 2004-08-30 18:00:00 | TS | -3.4 | 87.8 | ... | 45 | 3 | 175 |
5 rows × 174 columns
Filtering by Storm Name or SID#
Next, we’ll filter the data to retrieve information about a specific storm. Here, we use the storm name “PHOEBE.”
#get data for a specific storm.  You can use either the name or the SID.
ibtracs_phoebe=ibtracs_data[ibtracs_data['NAME'] == 'PHOEBE']
ibtracs_phoebe.head(5)
| SID | SEASON | NUMBER | BASIN | SUBBASIN | NAME | ISO_TIME | NATURE | LAT | LON | ... | BOM_GUST_PER | REUNION_GUST | REUNION_GUST_PER | USA_SEAHGT | USA_SEARAD_NE | USA_SEARAD_SE | USA_SEARAD_SW | USA_SEARAD_NW | STORM_SPEED | STORM_DIR | |
|---|---|---|---|---|---|---|---|---|---|---|---|---|---|---|---|---|---|---|---|---|---|
| 590760 | 2004243S03088 | 2005 | 64 | SI | MM | PHOEBE | 2004-08-30 06:00:00 | TS | -2.8 | 87.7 | ... | 40 | 3 | 160 | |||||||
| 590761 | 2004243S03088 | 2005 | 64 | SI | MM | PHOEBE | 2004-08-30 09:00:00 | TS | -3.0 | 87.8 | ... | 3 | 165 | ||||||||
| 590762 | 2004243S03088 | 2005 | 64 | SI | MM | PHOEBE | 2004-08-30 12:00:00 | TS | -3.1 | 87.8 | ... | 40 | 3 | 175 | |||||||
| 590763 | 2004243S03088 | 2005 | 64 | SI | MM | PHOEBE | 2004-08-30 15:00:00 | TS | -3.2 | 87.8 | ... | 3 | 0 | ||||||||
| 590764 | 2004243S03088 | 2005 | 64 | SI | MM | PHOEBE | 2004-08-30 18:00:00 | TS | -3.4 | 87.8 | ... | 45 | 3 | 175 |
5 rows × 174 columns
Subsetting Data for Specific Variables#
Finally, we’ll create a subset of the data that includes only the latitude (LAT), longitude (LON), and storm speed (STORM_SPEED) for the storm “PHOEBE.”
#subset data on LAT, LON, and Storm Speed for Phoebe
phoebe_subset = ibtracs_phoebe[['LAT', 'LON', 'STORM_SPEED']]
phoebe_subset.head(5)
| LAT | LON | STORM_SPEED | |
|---|---|---|---|
| 590760 | -2.8 | 87.7 | 3 |
| 590761 | -3.0 | 87.8 | 3 |
| 590762 | -3.1 | 87.8 | 3 |
| 590763 | -3.2 | 87.8 | 3 |
| 590764 | -3.4 | 87.8 | 3 |
Wrapping Up the CSV Data Exploration#
In this section, we explored how to filter and subset the IBTrACS dataset using basic criteria like season and storm name. These techniques allow you to narrow down your analysis to specific storms or time periods, making it easier to extract meaningful insights from the data.
Moving Forward: Integrating Spatial Data with Shapefiles#
Next, we’ll dive into working with shapefiles, a common format for spatial data in geographic information systems (GIS). Shapefiles are essential when you want to visualize storm tracks on a map or analyze how storms interact with specific geographic regions. Let’s get started!
Shapefiles#
Shapefiles are a common format for geographic data. In this section, we will use Geopandas to load and analyze shapefiles containing tropical cyclone paths. This allows us to visualize cyclone tracks on a map, providing a spatial understanding of the data. Shape files consist of geometric features like points, lines, and polygons that represent real-world objects such as cities, roads, or boundaries.
Why Use Shapefiles?
Shapefiles allow you to visualize and analyze geographic data spatially. For instance, in the context of tropical cyclones, they can represent the paths of storms, enabling you to:
Visualize Data: See the spatial distribution of cyclone tracks on a map.
Perform Spatial Analysis: Analyze relationships between storm paths and other geographic features, like coastlines or population centers.
Integrate with Other Data: Overlay cyclone paths with other maps (e.g., population, infrastructure) for more comprehensive analysis.
In this section, we’ll use Geopandas to load cyclone path shapefiles and visualize them on a map. Check the readme in this tutorial for notes on installing geopandas
Steps:#
Load the shapefiles using Geopandas.
Plot the cyclone tracks on a map to visualize their paths.
Explore the relationship between storm intensity and geography.
Downloading Shapefile Data#
In this step, we download the zipped shapefile containing the cyclone tracks from an online source. We will use the requests library to handle the HTTP request. The shapefile is provided by the NOAA’s International Best Track Archive for Climate Stewardship (IBTrACS).
Downloading files programmatically can be particularly useful when working with large datasets or when you need to automate data retrieval. Here, we demonstrate how to download the shapefile and handle potential errors gracefully.
# URL to the zipped shapefile
url = 'https://www.ncei.noaa.gov/data/international-best-track-archive-for-climate-stewardship-ibtracs/v04r01/access/shapefile/IBTrACS.ALL.list.v04r01.lines.zip'

# Try to download the file and handle potential errors
try:
    response = requests.get(url, timeout=10)
    response.raise_for_status()  # This will raise an HTTPError if the request was unsuccessful
    zip_file_content = response.content
    print("File downloaded successfully.")

    # Check the content's metadata
    print(response.headers)

except requests.exceptions.HTTPError as err:
    print(f"HTTP error occurred: {err}")
File downloaded successfully.
{'Date': 'Thu, 12 Sep 2024 16:10:48 GMT', 'Server': 'Apache', 'Strict-Transport-Security': 'max-age=31536000', 'Last-Modified': 'Tue, 10 Sep 2024 10:16:09 GMT', 'ETag': '"2cab8ee-621c12986062e"', 'Accept-Ranges': 'bytes', 'Content-Length': '46840046', 'Content-Type': 'application/zip', 'Access-Control-Allow-Origin': '*', 'Access-Control-Allow-Headers': 'X-Requested-With, Content-Type', 'Connection': 'close'}
Checking the Downloaded File’s Metadata#
After successfully downloading the shapefile, it’s important to verify what we have received. The response.headers attribute provides metadata about the downloaded file, such as its content type, size, and other HTTP headers. This information can be useful to confirm that the download was successful and that the file is in the expected format.
# Check the content's metadata
if zip_file_content:
    print(response.headers)
{'Date': 'Thu, 12 Sep 2024 16:10:48 GMT', 'Server': 'Apache', 'Strict-Transport-Security': 'max-age=31536000', 'Last-Modified': 'Tue, 10 Sep 2024 10:16:09 GMT', 'ETag': '"2cab8ee-621c12986062e"', 'Accept-Ranges': 'bytes', 'Content-Length': '46840046', 'Content-Type': 'application/zip', 'Access-Control-Allow-Origin': '*', 'Access-Control-Allow-Headers': 'X-Requested-With, Content-Type', 'Connection': 'close'}
Understanding the Response Headers#
After successfully downloading the shapefile, we can inspect the response headers to gain some insight into the file and the server’s response. Here are a few key elements from the headers:
Date: The timestamp when the server processed the request (
'Wed, 14 Aug 2024 19:47:32 GMT').Content-Length: The size of the downloaded file in bytes (
'46718951'), which helps us understand how large the download is.Content-Type: Indicates the type of file being returned, in this case, a ZIP archive (
'application/zip').Last-Modified: The date and time when the file was last modified on the server (
'Tue, 13 Aug 2024 10:16:49 GMT').ETag: A unique identifier for the file’s version (
'"2c8dfe7-61f8de85a9be0"'), which can be useful for caching.
These headers provide important information about the file and the request, helping us confirm that we’ve received the correct content and understanding the file’s characteristics.
Saving the Shapefile Locally#
After downloading the shapefile from the URL, the next step is to save it locally. This allows us to inspect the file manually and use it in further analysis. By saving the file, you can:
Ensure File Integrity: Saving the file locally allows you to verify that the download was successful and the file is complete.
Manual Inspection: You can open the file in a file explorer or a specialized GIS software to check its contents and structure.
Reuse in Future Work: Keeping a local copy means you can reuse the data without needing to re-download it each time.
The code below saves the downloaded content as a ZIP file named IBTrACS.zip:
# Save the file locally for inspection
with open('IBTrACS.zip', 'wb') as f:
    f.write(zip_file_content)

print("File saved locally as IBTrACS.zip. Inspect this file manually.")
File saved locally as IBTrACS.zip. Inspect this file manually.
Extracting and Inspecting the Shapefile#
Now that we have the ZIP file saved locally, the next step is to extract its contents and locate the shapefile within. Shapefiles typically consist of several files, and we need to extract all of them to work with the geographic data.
In this section, we will:
Inspect the Contents: Look inside the ZIP file to see what files are included.
Extract Files: Unzip the contents to a directory for further use.
Load the Shapefile: Use Geopandas to load the shapefile and inspect the first few rows of data.
Here’s the code:
with zipfile.ZipFile('IBTrACS.zip', 'r') as z:
    # Inspect contents to find the shapefile
    print(z.namelist())  # This will show all files in the zip
    # Extract the shapefile and associated files into a temporary directory
    z.extractall('IBTrACS_unzipped')

# Read the shapefile from the extracted files
shapefile_path = 'IBTrACS_unzipped/IBTrACS.ALL.list.v04r01.lines.shp'
ibtracs_gdf = gpd.read_file(shapefile_path)

# Inspect the data
print(ibtracs_gdf.head())
['IBTrACS.ALL.list.v04r01.lines.dbf', 'IBTrACS.ALL.list.v04r01.lines.prj', 'IBTrACS.ALL.list.v04r01.lines.shp', 'IBTrACS.ALL.list.v04r01.lines.shx']
             SID  SEASON  NUMBER BASIN SUBBASIN     NAME             ISO_TIME  \
0  1842298N11080    1842       1    NI       BB  UNNAMED  1842-10-25 03:00:00
1  1842298N11080    1842       1    NI       BB  UNNAMED  1842-10-25 06:00:00
2  1842298N11080    1842       1    NI       BB  UNNAMED  1842-10-25 09:00:00
3  1842298N11080    1842       1    NI       BB  UNNAMED  1842-10-25 12:00:00
4  1842298N11080    1842       1    NI       BB  UNNAMED  1842-10-25 15:00:00

  NATURE   LAT   LON  ...  USA_SEA_SW  USA_SEA_NW STORM_SPD STORM_DR  year  \
0     NR  10.9  80.3  ...         NaN         NaN         9      265  1842
1     NR  10.9  79.8  ...         NaN         NaN         9      265  1842
2     NR  10.8  79.4  ...         NaN         NaN         9      265  1842
3     NR  10.8  78.9  ...         NaN         NaN         9      265  1842
4     NR  10.8  78.4  ...         NaN         NaN         9      270  1842

   month day hour min                                   geometry
0     10  25    3   0  LINESTRING (80.30005 10.9, 79.80005 10.9)
1     10  25    6   0  LINESTRING (79.80005 10.9, 79.40002 10.8)
2     10  25    9   0  LINESTRING (79.40002 10.8, 78.90002 10.8)
3     10  25   12   0  LINESTRING (78.90002 10.8, 78.40002 10.8)
4     10  25   15   0  LINESTRING (78.40002 10.8, 77.90002 10.8)

[5 rows x 180 columns]
Filtering the Shapefile Data for a Specific Storm#
Now that we’ve successfully loaded the shapefile into a GeoDataFrame, we can start working with the data. In this step, we’ll filter the data to focus on a specific storm. For demonstration purposes, we’ll filter the data for the storm named “PHOEBE.”
Filtering the data allows us to isolate and analyze the paths, intensities, and other characteristics of a particular storm, which can be very useful for targeted studies or visualizations.
# Replace 'StormName' with the actual storm name you want to filter by
phoebe_gdf = ibtracs_gdf[ibtracs_gdf['NAME'] == 'PHOEBE']
Creating a Subset of the GeoDataFrame#
After filtering the GeoDataFrame to isolate data for the storm “PHOEBE,” the next step is to create a subset of the data. Here, we’ll focus on the geometry, latitude (LAT), and longitude (LON) columns. This subset will allow us to work more efficiently with just the essential information needed for mapping and analysis.
By reducing the dataset to these key columns, we can streamline our subsequent analysis and visualizations.
# Subset the GeoDataFrame
subsetphoebe_gdf = phoebe_gdf[['geometry', 'LAT', 'LON']]

# Inspect the subset data
print(subsetphoebe_gdf.head())
                                         geometry  LAT   LON
579419    LINESTRING (87.69995 -2.8, 87.80005 -3) -2.8  87.7
579420    LINESTRING (87.80005 -3, 87.80005 -3.1) -3.0  87.8
579421  LINESTRING (87.80005 -3.1, 87.80005 -3.2) -3.1  87.8
579422  LINESTRING (87.80005 -3.2, 87.80005 -3.4) -3.2  87.8
579423  LINESTRING (87.80005 -3.4, 87.80005 -3.6) -3.4  87.8
Plotting the Subset Data#
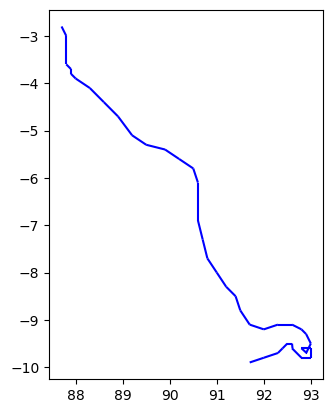
To begin visualizing the data, we will create a basic plot of the subsetted GeoDataFrame. While this initial plot, which simply marks the locations of the storm’s path, may not be very informative on its own, it sets the stage for more detailed and meaningful visualizations using geographic maps.
By plotting this data, we can quickly check that our subset was created correctly and that the storm’s path data is being accurately represented.
# Plot the data (not that useful)
subsetphoebe_gdf.plot(marker='o', color='blue', markersize=5)
plt.show()
Visualizing the Storm Track on a Map#
After obtaining and visualizing a basic plot of the storm’s path, we can now enhance our visualization by plotting the data on an interactive map using Folium. This map will allow us to see the storm’s track more clearly and interact with the data points.
The map will include:
Circle markers to represent the positions of the storm along its path.
A polyline to connect these points, showing the storm’s track over time.
This visualization provides a more intuitive understanding of the storm’s movement across geographic locations.
# Create a base map centered around the average latitude and longitude of the storm's path
m = folium.Map(location=[subsetphoebe_gdf['LAT'].mean(), subsetphoebe_gdf['LON'].mean()], zoom_start=5)

# Add storm track to the map
for _, row in subsetphoebe_gdf.iterrows():
    folium.CircleMarker(
        location=[row['LAT'], row['LON']],
        radius=5,
        color='blue',
        fill=True,
        fill_color='blue',
        fill_opacity=0.6
    ).add_to(m)

# Add a polyline to connect the storm track points
coordinates = subsetphoebe_gdf[['LAT', 'LON']].values.tolist()
folium.PolyLine(locations=coordinates, color='blue').add_to(m)

# Display the map in the notebook
m
NetCDF#
The NetCDF format is highly efficient for handling large and complex datasets, especially those with multiple dimensions like time and space. In this section, we will load and analyze the IBTrACS data in NetCDF format. This allows us to perform more advanced analyses, such as tracking storm progression over time.
Steps:#
Load the NetCDF file using the
netCDF4library.Extract specific variables like latitude, longitude, and wind speed.
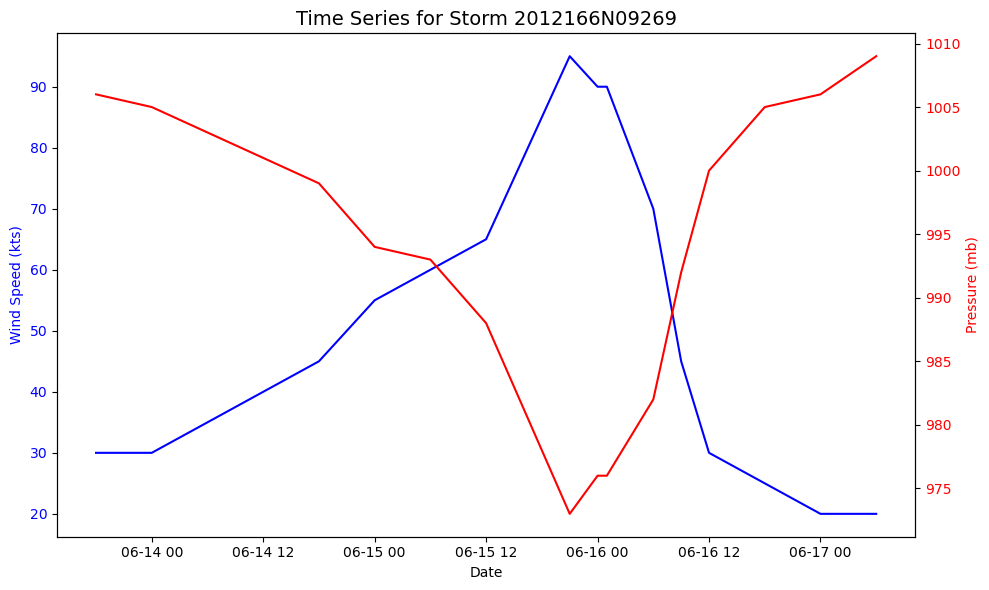
Plot the time series data to analyze the progression of a specific storm.
Transitioning from Shapefiles to NetCDF4#
While shapefiles gave us a powerful way to visualize tropical cyclone tracks spatially, NetCDF4 files provide a more detailed and complex representation of storm data across multiple dimensions. This is particularly useful when dealing with large-scale, time-series data, where we want to analyze not just where storms occurred but also how their characteristics evolved over time.
Let’s start by loading the NetCDF4 data and examining its structure.
from netCDF4 import Dataset
Accessing IBTrACS Data in NetCDF Format#
This data is maintained by the NOAA National Centers for Environmental Information (NCEI).
The dataset we are using is in NetCDF format, which is ideal for storing large, multi-dimensional data such as the spatial and temporal information of tropical cyclones. NetCDF files can contain multiple variables and dimensions, making them well-suited for complex atmospheric and oceanographic datasets.
You can explore more about the IBTrACS dataset and access additional data formats here.
Loading the NetCDF Data#
Let’s start by accessing the NetCDF file from the IBTrACS archive:
# URL to the NetCDF file
url = "https://www.ncei.noaa.gov/data/international-best-track-archive-for-climate-stewardship-ibtracs/v04r01/access/netcdf/IBTrACS.ALL.v04r01.nc"

# Explanation:
# The above URL points to the latest version (v04r01) of the IBTrACS dataset in NetCDF format.
# This file contains global tropical cyclone data, ,including information on storm tracks, intensity, and other key features.
# Download the file
response = requests.get(url)
if response.status_code == 200:
    with open('IBTrACS.ALL.v04r01.nc', 'wb') as f:
        f.write(response.content)
    print("File downloaded successfully.")
else:
    print(f"Failed to download file. Status code: {response.status_code}")
File downloaded successfully.
Understanding the NetCDF4 Structure#
The output from the code above provides a detailed overview of the NetCDF4 file, including its dimensions, variables, and attributes. Each variable in the file represents a different type of data, such as latitude, longitude, time, or specific meteorological measurements. Understanding this structure is crucial for selecting and extracting the right data for your analysis.
Next, we will extract specific variables related to storm intensity, location, and time, and visualize them to see how the storm’s characteristics evolve over its lifetime.
# Load the NetCDF file
nc_file = Dataset('IBTrACS.ALL.v04r01.nc', mode='r')

# Inspect the file structure
print(nc_file)

# List all variables in the file
print(nc_file.variables.keys())
<class 'netCDF4._netCDF4.Dataset'>
root group (NETCDF4 data model, file format HDF5):
    title: IBTrACS - International Best Track Archive for Climate Stewardship - version v04r01, Position, intensity and other information for known tropical cyclones
    summary: The intent of the IBTrACS project is to overcome best track data availability issues that arise from multiple agencies producing data for different storms in different formats. This was achieved by working directly with all the Regional Specialized Meteorological Centers and other international centers and individuals to create a global best track dataset, merging storm information from multiple agencies into one product and archiving the data for public use.
    source: The original data are tropical cyclone position, intensity and otherinformation provided by various agencies and people. This is a collection of all data on each tropical cyclone recorded.
    Conventions: ACDD-1.3
    Conventions_note: Data are nearly CF-1.7 compliant. The sole issue is the storage of missing data in the latitude/longitude/time variables. Otherwise, data are CF compliant.
    product_version: v04r01
    project: International Best Track Archive for Climate Stewardship (IBTrACS)
    processing_level: NOAA Processing Level 2, Data products are derived geophysical variables at the same resolution and locations as the level 1 source data
    acknowledgement: IBTrACS was produced by a team of scientists from NOAA in collaboration with scientists worldwide.
    references: https://www.ncei.noaa.gov/products/international-best-track-archive, doi:10.1175/2009BAMS2755.1
    institution: National Centers for Environmental Information, NESDIS, NOAA, U.S. Department of Commerce
    publisher_type: institution
    publisher_name: National Centers for Environmental Information, NESDIS, NOAA, U.S. Department of Commerce
    publisher_email: ncei.sat.info@noaa.gov
    publisher_institution: National Centers for Environmental Information, NESDIS, NOAA, U.S. Department of Commerce
    publisher_url: https://ncei.noaa.gov/
    creator_type: group
    creator_name: IBTrACS Science Team (Jennifer Gahtan, Ken Knapp, Carl Schreck, Howard Diamond)
    creator_institution: National Centers for Environmental Information, NESDIS, NOAA, U.S. Department of Commerce
    creator_email: ibtracs.team@noaa.gov
    creator_url: https://www.ncei.noaa.gov/products/international-best-track-archive
    contributor_name: "National Hurricane Center, National Weather Service, NOAA, U.S. Department of Commerce","Central Pacific Hurricane Center, National Weather Service, NOAA, U.S. Department of Commerce","Japan Meteorological Agency, RSMC Tokyo, Japan","India Meteorological Department, RSMC New Delhi, India","Bureau of Meteorology, Australia","MetService, TCWC Wellington, New Zealand","Fiji Meteorological Service, RSMC Fiji, Fiji","MeteoFrance, La Reunion, RSMC La Reunion","Shanghai Typhoon Institute, Chinese Meteorological Administration, China","Hong Kong Observatory, Hong Kong""Korea Meteorological Administration, South Korea""Joint Typhoon Warning Center, U.S. Department of Defense","National Center for Atmospheric Research, University Corporation for Atmospheric Research","Charlie Neumann Southern Hemisphere Dataset","Mike Chenoweth North Atlantic Dataset"
    contributor_role: These agencies and people provide track data and best track data used to produce IBTrACS.
    date_created: 2024-08-28 02:16:44
    date_issued: 2024-08-28 02:16:44
    time_coverage_start: 1842-10-25T03:00:00
    time_coverage_end: 2024-08-28 02:16:44
    geospatial_lat_min: 80.0
    geospatial_lat_max: -80.0
    geospatial_lat_units: degrees_north
    geospatial_lat_resolution: 0.10
    geospatial_lon_min: -180.0
    geospatial_lon_max:  180.0
    geospatial_lon_units: degrees_east
    geospatial_lon_resolution: 0.10
    geospatial_vertical_min: not applicable
    geospatial_vertical_max: not applicable
    naming_authority: gov.noaa.ncei
    id: 1842298N11080.ibtracs_int.v04r01.nc
    metadata_link: doi:10.25921/82ty-9e16
    keywords: EARTH SCIENCE> ATMOSPHERE> WEATHER EVENTS> TROPICAL CYCLONES> MAXIMUM SURFACE WIND, EARTH SCIENCE> ATMOSPHERE> WEATHER EVENTS> TROPICAL CYCLONES> MINIMUM CENTRAL PRESSURE, EARTH SCIENCE> ATMOSPHERE> WEATHER EVENTS> TROPICAL CYCLONES> TROPICAL CYCLONE TRACK, EARTH SCIENCE> ATMOSPHERE> WEATHER EVENTS> TROPICAL CYCLONES> TROPICAL CYCLONE FORCE WIND EXTENT, EARTH SCIENCE> ATMOSPHERE> WEATHER EVENTS> TROPICAL CYCLONES> TROPICAL CYCLONE RADIUS, EARTH SCIENCE> ATMOSPHERE> WEATHER EVENTS> TROPICAL CYCLONES> MAXIMUM 1-MINUTE SUSTAINED WIND, EARTH SCIENCE> ATMOSPHERE> WEATHER EVENTS> SUBTROPICAL CYCLONES > SUBTROPICAL STORM
    keywords_vocabulary: GCMD Science Keywords Version 8.6
    standard_name_vocabulary: CF Standard Name Table v52
    history: Tue Sep 10 05:38:09 2024: ncks --no_abc --cnk_byt 5000000 -4 -L 5 temp.nc -O netcdf/IBTrACS.ALL.v04r01.nc
Tue Sep 10 05:24:50 2024: ncrcat -6 -H -O netcdf/ibtracs.ALL.v04r01.nc
Produced by IBTrACS for individual tracks and merged into basin and temporal collections using netCDF operators (ncrcat)
    license: These data may be redistributed and used without restriction.
    featureType: trajectory
    cdm_data_type: Trajectory
    comment: The tracks of TCs generally look like a trajectory except that it wasn't expedient to use the CF trajectory type. The team stored data in a way that approximates the trajectory profile, where each new track (each new storm) is a new trajectory.
    NCO: netCDF Operators version 5.0.7 (Homepage = http://nco.sf.net, Code = http://github.com/nco/nco)
    dimensions(sizes): storm(13380), charsn(13), date_time(360), char2(2), char128(128), niso(19), char15(15), char32(32), char1(1), quadrant(4), char6(6), char3(3), char10(10)
    variables(dimensions): int16 numobs(storm), |S1 sid(storm, charsn), int16 season(storm), int16 number(storm), |S1 basin(storm, date_time, char2), |S1 subbasin(storm, date_time, char2), |S1 name(storm, char128), |S1 source_usa(storm, char128), |S1 source_jma(storm, char128), |S1 source_cma(storm, char128), |S1 source_hko(storm, char128), |S1 source_kma(storm, char128), |S1 source_new(storm, char128), |S1 source_reu(storm, char128), |S1 source_bom(storm, char128), |S1 source_nad(storm, char128), |S1 source_wel(storm, char128), |S1 source_td5(storm, char128), |S1 source_td6(storm, char128), |S1 source_ds8(storm, char128), |S1 source_neu(storm, char128), |S1 source_mlc(storm, char128), float64 time(storm, date_time), |S1 iso_time(storm, date_time, niso), |S1 nature(storm, date_time, char2), float32 lat(storm, date_time), float32 lon(storm, date_time), int16 wmo_wind(storm, date_time), int16 wmo_pres(storm, date_time), |S1 wmo_agency(storm, date_time, niso), |S1 track_type(storm, niso), |S1 main_track_sid(storm, charsn), int16 dist2land(storm, date_time), int16 landfall(storm, date_time), |S1 iflag(storm, date_time, char15), |S1 usa_agency(storm, date_time, char32), |S1 usa_atcf_id(storm, date_time, char32), float32 usa_lat(storm, date_time), float32 usa_lon(storm, date_time), |S1 usa_record(storm, date_time, char1), |S1 usa_status(storm, date_time, char2), int16 usa_wind(storm, date_time), int16 usa_pres(storm, date_time), int8 usa_sshs(storm, date_time), int16 usa_r34(storm, date_time, quadrant), int16 usa_r50(storm, date_time, quadrant), int16 usa_r64(storm, date_time, quadrant), int16 usa_poci(storm, date_time), int16 usa_roci(storm, date_time), int16 usa_rmw(storm, date_time), int16 usa_eye(storm, date_time), float32 tokyo_lat(storm, date_time), float32 tokyo_lon(storm, date_time), int8 tokyo_grade(storm, date_time), int16 tokyo_wind(storm, date_time), int16 tokyo_pres(storm, date_time), int8 tokyo_r50_dir(storm, date_time), int16 tokyo_r50_long(storm, date_time), int16 tokyo_r50_short(storm, date_time), int8 tokyo_r30_dir(storm, date_time), int16 tokyo_r30_long(storm, date_time), int16 tokyo_r30_short(storm, date_time), int8 tokyo_land(storm, date_time), float32 cma_lat(storm, date_time), float32 cma_lon(storm, date_time), int8 cma_cat(storm, date_time), int16 cma_wind(storm, date_time), int16 cma_pres(storm, date_time), float32 hko_lat(storm, date_time), float32 hko_lon(storm, date_time), |S1 hko_cat(storm, date_time, char6), int16 hko_wind(storm, date_time), int16 hko_pres(storm, date_time), float32 kma_lat(storm, date_time), float32 kma_lon(storm, date_time), |S1 kma_cat(storm, date_time, char3), int16 kma_wind(storm, date_time), int16 kma_pres(storm, date_time), float32 kma_r50_dir(storm, date_time), int16 kma_r50_long(storm, date_time), int16 kma_r50_short(storm, date_time), float32 kma_r30_dir(storm, date_time), int16 kma_r30_long(storm, date_time), int16 kma_r30_short(storm, date_time), float32 newdelhi_lat(storm, date_time), float32 newdelhi_lon(storm, date_time), |S1 newdelhi_grade(storm, date_time, char10), int16 newdelhi_wind(storm, date_time), int16 newdelhi_pres(storm, date_time), int16 newdelhi_ci(storm, date_time), int16 newdelhi_dp(storm, date_time), int16 newdelhi_poci(storm, date_time), float32 reunion_lat(storm, date_time), float32 reunion_lon(storm, date_time), int8 reunion_type(storm, date_time), int16 reunion_wind(storm, date_time), int16 reunion_pres(storm, date_time), int16 reunion_tnum(storm, date_time), int16 reunion_ci(storm, date_time), int16 reunion_rmw(storm, date_time), int16 reunion_r34(storm, date_time, quadrant), int16 reunion_r50(storm, date_time, quadrant), int16 reunion_r64(storm, date_time, quadrant), float32 bom_lat(storm, date_time), float32 bom_lon(storm, date_time), int8 bom_type(storm, date_time), int16 bom_wind(storm, date_time), int16 bom_pres(storm, date_time), int16 bom_tnum(storm, date_time), int16 bom_ci(storm, date_time), int16 bom_rmw(storm, date_time), int16 bom_r34(storm, date_time, quadrant), int16 bom_r50(storm, date_time, quadrant), int16 bom_r64(storm, date_time, quadrant), int16 bom_roci(storm, date_time), int16 bom_poci(storm, date_time), int16 bom_eye(storm, date_time), int8 bom_pos_method(storm, date_time), int8 bom_pres_method(storm, date_time), float32 nadi_lat(storm, date_time), float32 nadi_lon(storm, date_time), int8 nadi_cat(storm, date_time), int16 nadi_wind(storm, date_time), int16 nadi_pres(storm, date_time), float32 wellington_lat(storm, date_time), float32 wellington_lon(storm, date_time), int16 wellington_wind(storm, date_time), int16 wellington_pres(storm, date_time), float32 ds824_lat(storm, date_time), float32 ds824_lon(storm, date_time), |S1 ds824_stage(storm, date_time, char2), int16 ds824_wind(storm, date_time), int16 ds824_pres(storm, date_time), float32 td9636_lat(storm, date_time), float32 td9636_lon(storm, date_time), int8 td9636_stage(storm, date_time), int16 td9636_wind(storm, date_time), int16 td9636_pres(storm, date_time), float32 td9635_lat(storm, date_time), float32 td9635_lon(storm, date_time), int16 td9635_wind(storm, date_time), int16 td9635_pres(storm, date_time), int16 td9635_roci(storm, date_time), float32 neumann_lat(storm, date_time), float32 neumann_lon(storm, date_time), |S1 neumann_class(storm, date_time, char2), int16 neumann_wind(storm, date_time), int16 neumann_pres(storm, date_time), float32 mlc_lat(storm, date_time), float32 mlc_lon(storm, date_time), |S1 mlc_class(storm, date_time, char2), int16 mlc_wind(storm, date_time), int16 mlc_pres(storm, date_time), int16 usa_gust(storm, date_time), int16 bom_gust(storm, date_time), int16 bom_gust_per(storm, date_time), int16 reunion_gust(storm, date_time), int16 reunion_gust_per(storm, date_time), int16 usa_seahgt(storm, date_time), int16 usa_searad(storm, date_time, quadrant), int16 storm_speed(storm, date_time), int16 storm_dir(storm, date_time)
    groups:
dict_keys(['numobs', 'sid', 'season', 'number', 'basin', 'subbasin', 'name', 'source_usa', 'source_jma', 'source_cma', 'source_hko', 'source_kma', 'source_new', 'source_reu', 'source_bom', 'source_nad', 'source_wel', 'source_td5', 'source_td6', 'source_ds8', 'source_neu', 'source_mlc', 'time', 'iso_time', 'nature', 'lat', 'lon', 'wmo_wind', 'wmo_pres', 'wmo_agency', 'track_type', 'main_track_sid', 'dist2land', 'landfall', 'iflag', 'usa_agency', 'usa_atcf_id', 'usa_lat', 'usa_lon', 'usa_record', 'usa_status', 'usa_wind', 'usa_pres', 'usa_sshs', 'usa_r34', 'usa_r50', 'usa_r64', 'usa_poci', 'usa_roci', 'usa_rmw', 'usa_eye', 'tokyo_lat', 'tokyo_lon', 'tokyo_grade', 'tokyo_wind', 'tokyo_pres', 'tokyo_r50_dir', 'tokyo_r50_long', 'tokyo_r50_short', 'tokyo_r30_dir', 'tokyo_r30_long', 'tokyo_r30_short', 'tokyo_land', 'cma_lat', 'cma_lon', 'cma_cat', 'cma_wind', 'cma_pres', 'hko_lat', 'hko_lon', 'hko_cat', 'hko_wind', 'hko_pres', 'kma_lat', 'kma_lon', 'kma_cat', 'kma_wind', 'kma_pres', 'kma_r50_dir', 'kma_r50_long', 'kma_r50_short', 'kma_r30_dir', 'kma_r30_long', 'kma_r30_short', 'newdelhi_lat', 'newdelhi_lon', 'newdelhi_grade', 'newdelhi_wind', 'newdelhi_pres', 'newdelhi_ci', 'newdelhi_dp', 'newdelhi_poci', 'reunion_lat', 'reunion_lon', 'reunion_type', 'reunion_wind', 'reunion_pres', 'reunion_tnum', 'reunion_ci', 'reunion_rmw', 'reunion_r34', 'reunion_r50', 'reunion_r64', 'bom_lat', 'bom_lon', 'bom_type', 'bom_wind', 'bom_pres', 'bom_tnum', 'bom_ci', 'bom_rmw', 'bom_r34', 'bom_r50', 'bom_r64', 'bom_roci', 'bom_poci', 'bom_eye', 'bom_pos_method', 'bom_pres_method', 'nadi_lat', 'nadi_lon', 'nadi_cat', 'nadi_wind', 'nadi_pres', 'wellington_lat', 'wellington_lon', 'wellington_wind', 'wellington_pres', 'ds824_lat', 'ds824_lon', 'ds824_stage', 'ds824_wind', 'ds824_pres', 'td9636_lat', 'td9636_lon', 'td9636_stage', 'td9636_wind', 'td9636_pres', 'td9635_lat', 'td9635_lon', 'td9635_wind', 'td9635_pres', 'td9635_roci', 'neumann_lat', 'neumann_lon', 'neumann_class', 'neumann_wind', 'neumann_pres', 'mlc_lat', 'mlc_lon', 'mlc_class', 'mlc_wind', 'mlc_pres', 'usa_gust', 'bom_gust', 'bom_gust_per', 'reunion_gust', 'reunion_gust_per', 'usa_seahgt', 'usa_searad', 'storm_speed', 'storm_dir'])
Extracting Latitude and Longitude#
First, we will access the latitude and longitude variables from the NetCDF file to understand the geographical spread of the data.
# Access specific variables
latitudes = nc_file.variables['lat'][:]
longitudes = nc_file.variables['lon'][:]

# Inspect the data
print(latitudes)
print(longitudes)
[[10.899999618530273 10.899999618530273 10.800000190734863 ... -- -- --]
 [10.0 10.0 10.100000381469727 ... -- -- --]
 [-9.0 -9.399999618530273 -9.800000190734863 ... -- -- --]
 ...
 [13.5 14.100000381469727 14.600000381469727 ... -- -- --]
 [27.700000762939453 28.100000381469727 28.5 ... -- -- --]
 [18.799999237060547 18.899999618530273 19.0 ... -- -- --]]
[[80.30000305175781 79.80000305175781 79.4000015258789 ... -- -- --]
 [74.30000305175781 74.19999694824219 74.0 ... -- -- --]
 [79.0 77.69999694824219 76.5 ... -- -- --]
 ...
 [124.69999694824219 123.9000015258789 123.19999694824219 ... -- -- --]
 [147.0 147.0 147.0 ... -- -- --]
 [-88.0999984741211 -88.5 -89.0 ... -- -- --]]
Filtering Data for a Specific Storm#
Next, we’ll extract additional variables, including storm IDs, wind speed, pressure, and time. We’ll filter the dataset for a specific storm ID (SID) to visualize its track. We’ll also handle missing data and visualize the storm’s path on a map.
print("Variables in the dataset:")
print(nc_file.variables.keys())

# Print details of each variable
for var in nc_file.variables:
    print(f"Variable: {var}")
    print(nc_file.variables[var])
Variables in the dataset:
dict_keys(['numobs', 'sid', 'season', 'number', 'basin', 'subbasin', 'name', 'source_usa', 'source_jma', 'source_cma', 'source_hko', 'source_kma', 'source_new', 'source_reu', 'source_bom', 'source_nad', 'source_wel', 'source_td5', 'source_td6', 'source_ds8', 'source_neu', 'source_mlc', 'time', 'iso_time', 'nature', 'lat', 'lon', 'wmo_wind', 'wmo_pres', 'wmo_agency', 'track_type', 'main_track_sid', 'dist2land', 'landfall', 'iflag', 'usa_agency', 'usa_atcf_id', 'usa_lat', 'usa_lon', 'usa_record', 'usa_status', 'usa_wind', 'usa_pres', 'usa_sshs', 'usa_r34', 'usa_r50', 'usa_r64', 'usa_poci', 'usa_roci', 'usa_rmw', 'usa_eye', 'tokyo_lat', 'tokyo_lon', 'tokyo_grade', 'tokyo_wind', 'tokyo_pres', 'tokyo_r50_dir', 'tokyo_r50_long', 'tokyo_r50_short', 'tokyo_r30_dir', 'tokyo_r30_long', 'tokyo_r30_short', 'tokyo_land', 'cma_lat', 'cma_lon', 'cma_cat', 'cma_wind', 'cma_pres', 'hko_lat', 'hko_lon', 'hko_cat', 'hko_wind', 'hko_pres', 'kma_lat', 'kma_lon', 'kma_cat', 'kma_wind', 'kma_pres', 'kma_r50_dir', 'kma_r50_long', 'kma_r50_short', 'kma_r30_dir', 'kma_r30_long', 'kma_r30_short', 'newdelhi_lat', 'newdelhi_lon', 'newdelhi_grade', 'newdelhi_wind', 'newdelhi_pres', 'newdelhi_ci', 'newdelhi_dp', 'newdelhi_poci', 'reunion_lat', 'reunion_lon', 'reunion_type', 'reunion_wind', 'reunion_pres', 'reunion_tnum', 'reunion_ci', 'reunion_rmw', 'reunion_r34', 'reunion_r50', 'reunion_r64', 'bom_lat', 'bom_lon', 'bom_type', 'bom_wind', 'bom_pres', 'bom_tnum', 'bom_ci', 'bom_rmw', 'bom_r34', 'bom_r50', 'bom_r64', 'bom_roci', 'bom_poci', 'bom_eye', 'bom_pos_method', 'bom_pres_method', 'nadi_lat', 'nadi_lon', 'nadi_cat', 'nadi_wind', 'nadi_pres', 'wellington_lat', 'wellington_lon', 'wellington_wind', 'wellington_pres', 'ds824_lat', 'ds824_lon', 'ds824_stage', 'ds824_wind', 'ds824_pres', 'td9636_lat', 'td9636_lon', 'td9636_stage', 'td9636_wind', 'td9636_pres', 'td9635_lat', 'td9635_lon', 'td9635_wind', 'td9635_pres', 'td9635_roci', 'neumann_lat', 'neumann_lon', 'neumann_class', 'neumann_wind', 'neumann_pres', 'mlc_lat', 'mlc_lon', 'mlc_class', 'mlc_wind', 'mlc_pres', 'usa_gust', 'bom_gust', 'bom_gust_per', 'reunion_gust', 'reunion_gust_per', 'usa_seahgt', 'usa_searad', 'storm_speed', 'storm_dir'])
Variable: numobs
<class 'netCDF4._netCDF4.Variable'>
int16 numobs(storm)
    long_name: Number of observations per system
    units: 1
    _FillValue: -9999
    coverage_content_type: coordinate
    cell_methods: storm: mean
unlimited dimensions:
current shape = (13380,)
filling on
Variable: sid
<class 'netCDF4._netCDF4.Variable'>
|S1 sid(storm, charsn)
    long_name: SID (IBTrACS Serial ID)
    cf_role: trajectory_id
    coverage_content_type: auxiliaryInformation
    cell_methods: storm: mean
unlimited dimensions:
current shape = (13380, 13)
filling on, default _FillValue of used
Variable: season
<class 'netCDF4._netCDF4.Variable'>
int16 season(storm)
    long_name: Season
    units: Year
    _FillValue: -9999
    description: Season when storm started
    coverage_content_type: physicalMeasurement
    cell_methods: storm: mean
unlimited dimensions:
current shape = (13380,)
filling on
Variable: number
<class 'netCDF4._netCDF4.Variable'>
int16 number(storm)
    long_name: Storm number (within season)
    units: 1
    coverage_content_type: auxiliaryInformation
    cell_methods: storm: mean
unlimited dimensions:
current shape = (13380,)
filling on, default _FillValue of -32767 used
Variable: basin
<class 'netCDF4._netCDF4.Variable'>
|S1 basin(storm, date_time, char2)
    long_name: Current basin
    Note: EP=East_Pacific NA=North_Atlantic NI=North_Indian SA=South_Atlantic SI=South_Indian SP=South_Pacific WP=Western_Pacific
    coverage_content_type: thematicClassification
    cell_methods: storm: mean
unlimited dimensions:
current shape = (13380, 360, 2)
filling on, default _FillValue of used
Variable: subbasin
<class 'netCDF4._netCDF4.Variable'>
|S1 subbasin(storm, date_time, char2)
    long_name: Current sub-basin
    Note: AS=Arabian_Sea BB=Bay_of_Bengal CP=Central_Pacific CS=Caribbean_Sea GM=Gulf_of_Mexico NA=North_Atlantic EA=Eastern_Australia WA=Western_Australia MM=No_subbasin_for_this_position
    coverage_content_type: thematicClassification
    cell_methods: storm: mean
unlimited dimensions:
current shape = (13380, 360, 2)
filling on, default _FillValue of used
Variable: name
<class 'netCDF4._netCDF4.Variable'>
|S1 name(storm, char128)
    long_name: Name of system
    description: May be a combination of names from different agencies
    coverage_content_type: thematicClassification
    cell_methods: storm: mean
unlimited dimensions:
current shape = (13380, 128)
filling on, default _FillValue of used
Variable: source_usa
<class 'netCDF4._netCDF4.Variable'>
|S1 source_usa(storm, char128)
    long_name: Source data information for this storm for USA track
    coverage_content_type: auxiliaryInformation
    cell_methods: storm: mean
unlimited dimensions:
current shape = (13380, 128)
filling on, default _FillValue of used
Variable: source_jma
<class 'netCDF4._netCDF4.Variable'>
|S1 source_jma(storm, char128)
    long_name: Source data information for this storm for RSMC Tokyo (Japan Meteorological Agency)  track
    coverage_content_type: auxiliaryInformation
    cell_methods: storm: mean
unlimited dimensions:
current shape = (13380, 128)
filling on, default _FillValue of used
Variable: source_cma
<class 'netCDF4._netCDF4.Variable'>
|S1 source_cma(storm, char128)
    long_name: Source data information for this storm for China (Chinese Meteorological Administration) track
    coverage_content_type: auxiliaryInformation
    cell_methods: storm: mean
unlimited dimensions:
current shape = (13380, 128)
filling on, default _FillValue of used
Variable: source_hko
<class 'netCDF4._netCDF4.Variable'>
|S1 source_hko(storm, char128)
    long_name: Source data information for this storm for Hong Kong (Hong Kong Observatory) track
    coverage_content_type: auxiliaryInformation
    cell_methods: storm: mean
unlimited dimensions:
current shape = (13380, 128)
filling on, default _FillValue of used
Variable: source_kma
<class 'netCDF4._netCDF4.Variable'>
|S1 source_kma(storm, char128)
    long_name: Source data information for this storm for South Korea (Korea Meteorological Administration) track
    coverage_content_type: auxiliaryInformation
    cell_methods: storm: mean
unlimited dimensions:
current shape = (13380, 128)
filling on, default _FillValue of used
Variable: source_new
<class 'netCDF4._netCDF4.Variable'>
|S1 source_new(storm, char128)
    long_name: Source data information for this storm for RSMC New Delhi (Indian Meteorological Department) track
    coverage_content_type: auxiliaryInformation
    cell_methods: storm: mean
unlimited dimensions:
current shape = (13380, 128)
filling on, default _FillValue of used
Variable: source_reu
<class 'netCDF4._netCDF4.Variable'>
|S1 source_reu(storm, char128)
    long_name: Source data information for this storm for RSMC La Reunion track
    coverage_content_type: auxiliaryInformation
    cell_methods: storm: mean
unlimited dimensions:
current shape = (13380, 128)
filling on, default _FillValue of used
Variable: source_bom
<class 'netCDF4._netCDF4.Variable'>
|S1 source_bom(storm, char128)
    long_name: Source data information for this storm for Australian TCWCs (Bureau of Meteorology) track
    coverage_content_type: auxiliaryInformation
    cell_methods: storm: mean
unlimited dimensions:
current shape = (13380, 128)
filling on, default _FillValue of used
Variable: source_nad
<class 'netCDF4._netCDF4.Variable'>
|S1 source_nad(storm, char128)
    long_name: Source data information for this storm for RSMC Nadi (Fiji) track
    coverage_content_type: auxiliaryInformation
    cell_methods: storm: mean
unlimited dimensions:
current shape = (13380, 128)
filling on, default _FillValue of used
Variable: source_wel
<class 'netCDF4._netCDF4.Variable'>
|S1 source_wel(storm, char128)
    long_name: Source data information for this storm for TCWC Wellington track
    coverage_content_type: auxiliaryInformation
    cell_methods: storm: mean
unlimited dimensions:
current shape = (13380, 128)
filling on, default _FillValue of used
Variable: source_td5
<class 'netCDF4._netCDF4.Variable'>
|S1 source_td5(storm, char128)
    long_name: Source data information for this storm for TD-9635 track
    Note: TD-9635 "Tropical Cyclone Analogs" produced by National Climatic Center in the 1970s
    coverage_content_type: auxiliaryInformation
    cell_methods: storm: mean
unlimited dimensions:
current shape = (13380, 128)
filling on, default _FillValue of used
Variable: source_td6
<class 'netCDF4._netCDF4.Variable'>
|S1 source_td6(storm, char128)
    long_name: Source data information for this storm for TD-9636 track
    Note: TD-9636 "Tropical Cyclone Data Global Consolidated" produced by National Climatic Center in the 1970s
    coverage_content_type: auxiliaryInformation
    cell_methods: storm: mean
unlimited dimensions:
current shape = (13380, 128)
filling on, default _FillValue of used
Variable: source_ds8
<class 'netCDF4._netCDF4.Variable'>
|S1 source_ds8(storm, char128)
    long_name: Source data information for this storm for ds824 track
    Note: NCAR/UCAR research data archive dataset ds824: Global Tropical Cyclone "Best Track" Position and Intensity Data
    coverage_content_type: auxiliaryInformation
    cell_methods: storm: mean
unlimited dimensions:
current shape = (13380, 128)
filling on, default _FillValue of used
Variable: source_neu
<class 'netCDF4._netCDF4.Variable'>
|S1 source_neu(storm, char128)
    long_name: Source data information for this storm for C. Neumann S. Hemi. track
    coverage_content_type: auxiliaryInformation
    cell_methods: storm: mean
unlimited dimensions:
current shape = (13380, 128)
filling on, default _FillValue of used
Variable: source_mlc
<class 'netCDF4._netCDF4.Variable'>
|S1 source_mlc(storm, char128)
    long_name: Source data information for this storm for M. Chenoweth track
    coverage_content_type: auxiliaryInformation
    cell_methods: storm: mean
unlimited dimensions:
current shape = (13380, 128)
filling on, default _FillValue of used
Variable: time
<class 'netCDF4._netCDF4.Variable'>
float64 time(storm, date_time)
    long_name: time
    standard_name: time
    units: days since 1858-11-17 00:00:00
    _FillValue: -9999000.0
    description: Nominally, time steps are 3 hourly, but can be more often since some agencies include extra position (e.g., times near landfall, maximum intensity, etc.)
    Note: Variable:time can be missing since the tracks are stored in a fixed 2-D grid where tracks have varying lengths
    calendar: standard
    coverage_content_type: physicalMeasurement
    cell_methods: storm: mean
unlimited dimensions:
current shape = (13380, 360)
filling on
Variable: iso_time
<class 'netCDF4._netCDF4.Variable'>
|S1 iso_time(storm, date_time, niso)
    long_name: Time (ISO)
    description: Nominally, time steps are 3 hourly, but can be more often since some agencies include extra position (e.g., times near landfall, maximum intensity, etc.)
    coverage_content_type: physicalMeasurement
    cell_methods: storm: mean
unlimited dimensions:
current shape = (13380, 360, 19)
filling on, default _FillValue of used
Variable: nature
<class 'netCDF4._netCDF4.Variable'>
|S1 nature(storm, date_time, char2)
    long_name: Nature of the cyclone
    Note: NR=Not_Reported DS=Disturbance TS=Tropical_System ET=Extratropical_System SS=Subtropical_System MX=MIXED_occurs_when_agencies_reported_inconsistent_types
    coverage_content_type: thematicClassification
    cell_methods: storm: mean
unlimited dimensions:
current shape = (13380, 360, 2)
filling on, default _FillValue of used
Variable: lat
<class 'netCDF4._netCDF4.Variable'>
float32 lat(storm, date_time)
    long_name: latitude
    standard_name: latitude
    units: degrees_north
    _FillValue: -9999.0
    description: This is merged position based on the position(s) from the various source datasets.
    Note: Variable:lat can be missing since the tracks are stored in a fixed 2-D grid where tracks have varying lengths
    coverage_content_type: coordinate
    cell_methods: storm: mean
unlimited dimensions:
current shape = (13380, 360)
filling on
Variable: lon
<class 'netCDF4._netCDF4.Variable'>
float32 lon(storm, date_time)
    long_name: longitude
    standard_name: longitude
    units: degrees_east
    _FillValue: -9999.0
    description: This is merged position based on the position(s) from the various source datasets.
    Note: Variable:lon can be missing since the tracks are stored in a fixed 2-D grid where tracks have varying lengths
    coverage_content_type: coordinate
    cell_methods: storm: mean
unlimited dimensions:
current shape = (13380, 360)
filling on
Variable: wmo_wind
<class 'netCDF4._netCDF4.Variable'>
int16 wmo_wind(storm, date_time)
    long_name: Maximum sustained wind speed from Official WMO agency
    units: kts
    _FillValue: -9999
    coverage_content_type: physicalMeasurement
    cell_methods: storm: mean
unlimited dimensions:
current shape = (13380, 360)
filling on
Variable: wmo_pres
<class 'netCDF4._netCDF4.Variable'>
int16 wmo_pres(storm, date_time)
    long_name: Minimum central preossure from  Official WMO agency
    units: mb
    _FillValue: -9999
    coverage_content_type: physicalMeasurement
    cell_methods: storm: mean
unlimited dimensions:
current shape = (13380, 360)
filling on
Variable: wmo_agency
<class 'netCDF4._netCDF4.Variable'>
|S1 wmo_agency(storm, date_time, niso)
    long_name: Official WMO agency
    coverage_content_type: thematicClassification
    cell_methods: storm: mean
unlimited dimensions:
current shape = (13380, 360, 19)
filling on, default _FillValue of used
Variable: track_type
<class 'netCDF4._netCDF4.Variable'>
|S1 track_type(storm, niso)
    long_name: Name of track type
    description: Tracks are either MAIN or SPUR. Spur tracks have points that either merge with or split from another track (or both). Main tracks are regular tracks. Spur tracks should be treated with caution.
    coverage_content_type: thematicClassification
    cell_methods: storm: mean
unlimited dimensions:
current shape = (13380, 19)
filling on, default _FillValue of used
Variable: main_track_sid
<class 'netCDF4._netCDF4.Variable'>
|S1 main_track_sid(storm, charsn)
    long_name: SID of the main track associated with this storm.
    description: If this track is a main, then this is the same as serial_id. If a spur, it namesthe associated main track.
    coverage_content_type: thematicClassification
    cell_methods: storm: mean
unlimited dimensions:
current shape = (13380, 13)
filling on, default _FillValue of used
Variable: dist2land
<class 'netCDF4._netCDF4.Variable'>
int16 dist2land(storm, date_time)
    long_name: Distance to Land at current location
    units: km
    _FillValue: -9999
    description: Distance to the nearest land point. Also acts as a land mask since 0km = over land. Uses present location ONLY.
    coverage_content_type: modelResult
    cell_methods: storm: mean
unlimited dimensions:
current shape = (13380, 360)
filling on
Variable: landfall
<class 'netCDF4._netCDF4.Variable'>
int16 landfall(storm, date_time)
    long_name: Minimum distance to land between current location and next.
    units: km
    _FillValue: -9999
    description: Describes landfall conditions between the present observation and the next (usually 3 hours) by providing minimum distance to land. So a value of 0 implies that the storm crosses a coastline prior to the next observation.
    coverage_content_type: modelResult
    cell_methods: storm: mean
unlimited dimensions:
current shape = (13380, 360)
filling on
Variable: iflag
<class 'netCDF4._netCDF4.Variable'>
|S1 iflag(storm, date_time, char15)
    long_name: Interpolation flag
    flag_values: O P I V _
    flag_names: Original Position_interpolated Intensity_values_interpolated Other_Values_Interpolated Nothing_reported
    description: Each character represents the source of the values for a particular reporting time. 15 characters represent 15 agencies.
    Note: Agency Order: USA, JMA, CMA, HKO, KMA, NewDelhi, La Reunion, BoM, Nadi, Wellington, TD9636, TD9635, ds824, Neumann, Chenoweth
    coverage_content_type: qualityInformation
    cell_methods: storm: mean
unlimited dimensions:
current shape = (13380, 360, 15)
filling on, default _FillValue of used
Variable: usa_agency
<class 'netCDF4._netCDF4.Variable'>
|S1 usa_agency(storm, date_time, char32)
    long_name: Source dataset for U.S. data
    coverage_content_type: auxiliaryInformation
    cell_methods: storm: mean
unlimited dimensions:
current shape = (13380, 360, 32)
filling on, default _FillValue of used
Variable: usa_atcf_id
<class 'netCDF4._netCDF4.Variable'>
|S1 usa_atcf_id(storm, date_time, char32)
    long_name: ATCF ID for the storm
    standard_name: automated_tropical_cyclone_forecasting_system_storm_identifier
    coverage_content_type: thematicClassification
    cell_methods: storm: mean
unlimited dimensions:
current shape = (13380, 360, 32)
filling on, default _FillValue of used
Variable: usa_lat
<class 'netCDF4._netCDF4.Variable'>
float32 usa_lat(storm, date_time)
    long_name: Latitude (U.S. Agency)
    units: degrees_north
    _FillValue: -9999.0
    coverage_content_type: coordinate
    cell_methods: storm: mean
unlimited dimensions:
current shape = (13380, 360)
filling on
Variable: usa_lon
<class 'netCDF4._netCDF4.Variable'>
float32 usa_lon(storm, date_time)
    long_name: Longitude (U.S. Agency)
    units: degrees_east
    _FillValue: -9999.0
    coverage_content_type: coordinate
    cell_methods: storm: mean
unlimited dimensions:
current shape = (13380, 360)
filling on
Variable: usa_record
<class 'netCDF4._netCDF4.Variable'>
|S1 usa_record(storm, date_time, char1)
    long_name: Storm record type
    description: C – Closest approach to a coast, not followed by a landfall, G – Genesis, I – An intensity peak in terms of both pressure and wind, L – Landfall (center of system crossing a coastline), P – Minimum in central pressure, R – Provides additional detail on the intensity of the cyclone when rapid changes are underway, S – Change of status of the system, T – Provides additional detail on the track (position) of the cyclone, W – Maximum sustained wind speed
    coverage_content_type: thematicClassification
    cell_methods: storm: mean
unlimited dimensions:
current shape = (13380, 360, 1)
filling on, default _FillValue of used
Variable: usa_status
<class 'netCDF4._netCDF4.Variable'>
|S1 usa_status(storm, date_time, char2)
    long_name: Storm status
    description:  DB - disturbance,  TD - tropical depression,  TS - tropical storm,  TY - typhoon,  ST - super typhoon,  TC - tropical cyclone,  HU, HR - hurricane,  SD - subtropical depression,  SS - subtropical storm,  EX - extratropical systems,  PT - post tropical,  IN - inland,  DS - dissipating,  LO - low,  WV - tropical wave,  ET - extrapolated,  MD - monsoon depression,  XX - unknown.
    coverage_content_type: thematicClassification
    cell_methods: storm: mean
unlimited dimensions:
current shape = (13380, 360, 2)
filling on, default _FillValue of used
Variable: usa_wind
<class 'netCDF4._netCDF4.Variable'>
int16 usa_wind(storm, date_time)
    long_name: Maximum sustained wind speed
    standard_name: tropical_cyclone_maximum_sustained_wind_speed
    units: kts
    valid_min: 1
    valid_max: 250
    _FillValue: -9999
    coordinates: time lon lat
    coverage_content_type: physicalMeasurement
    cell_methods: storm: mean
unlimited dimensions:
current shape = (13380, 360)
filling on
Variable: usa_pres
<class 'netCDF4._netCDF4.Variable'>
int16 usa_pres(storm, date_time)
    long_name: Minimum central pressure
    units: mb
    valid_min: 700
    valid_max: 1050
    _FillValue: -9999
    coverage_content_type: physicalMeasurement
    cell_methods: storm: mean
unlimited dimensions:
current shape = (13380, 360)
filling on
Variable: usa_sshs
<class 'netCDF4._netCDF4.Variable'>
int8 usa_sshs(storm, date_time)
    long_name: Saffir-Simpson Hurricane Wind Scale Category
    units: 1
    valid_min: -5
    valid_max: 5
    _FillValue: -15
    flag_values: [-5 -4 -3 -2 -1  0  1  2  3  4  5]
    flag_names: unknown_type_XX post_tropical_ET_EX_PT misc_disturbances_WV_LO_DB_DS_IN_MD subtropical_SS_SD tropical_depression_w_lt_34 tropical_storm_wind_35-63 hurricane_cat_1_wind_64-82 hurricane_cat_2_wind_83-95 hurricane_cat_3_wind_96-112 hurricane_cat_4_wind_113-136 hurricane_cat_5_wind_137+
    coverage_content_type: thematicClassification
    cell_methods: storm: mean
unlimited dimensions:
current shape = (13380, 360)
filling on
Variable: usa_r34
<class 'netCDF4._netCDF4.Variable'>
int16 usa_r34(storm, date_time, quadrant)
    long_name: Radius of 34 knot winds
    units: nmile
    valid_min: 1
    valid_max: 1000
    _FillValue: -9999
    coverage_content_type: physicalMeasurement
    cell_methods: storm: mean
unlimited dimensions:
current shape = (13380, 360, 4)
filling on
Variable: usa_r50
<class 'netCDF4._netCDF4.Variable'>
int16 usa_r50(storm, date_time, quadrant)
    long_name: Radius of 50 knot winds
    units: nmile
    valid_min: 1
    valid_max: 1000
    _FillValue: -9999
    coverage_content_type: physicalMeasurement
    cell_methods: storm: mean
unlimited dimensions:
current shape = (13380, 360, 4)
filling on
Variable: usa_r64
<class 'netCDF4._netCDF4.Variable'>
int16 usa_r64(storm, date_time, quadrant)
    long_name: Radius of 64 knot winds
    units: nmile
    valid_min: 1
    valid_max: 1000
    _FillValue: -9999
    coverage_content_type: physicalMeasurement
    cell_methods: storm: mean
unlimited dimensions:
current shape = (13380, 360, 4)
filling on
Variable: usa_poci
<class 'netCDF4._netCDF4.Variable'>
int16 usa_poci(storm, date_time)
    long_name: Pressure of outermost closed isobar (not best tracked)
    units: mb
    valid_min: 700
    valid_max: 1050
    _FillValue: -9999
    coverage_content_type: physicalMeasurement
    cell_methods: storm: mean
unlimited dimensions:
current shape = (13380, 360)
filling on
Variable: usa_roci
<class 'netCDF4._netCDF4.Variable'>
int16 usa_roci(storm, date_time)
    long_name: Pressure of outermost closed isobar (not best tracked)
    units: nmile
    valid_min: 1
    valid_max: 1000
    _FillValue: -9999
    coverage_content_type: physicalMeasurement
    cell_methods: storm: mean
unlimited dimensions:
current shape = (13380, 360)
filling on
Variable: usa_rmw
<class 'netCDF4._netCDF4.Variable'>
int16 usa_rmw(storm, date_time)
    long_name: Radius of maximum winds (not best tracked)
    standard_name: radius_of_tropical_cyclone_maximum_sustained_wind_speed
    units: nmile
    valid_min: 1
    valid_max: 1000
    _FillValue: -9999
    coverage_content_type: physicalMeasurement
    cell_methods: storm: mean
unlimited dimensions:
current shape = (13380, 360)
filling on
Variable: usa_eye
<class 'netCDF4._netCDF4.Variable'>
int16 usa_eye(storm, date_time)
    long_name: Eye diameter (not best tracked)
    standard_name: radius_of_tropical_cyclone_eye
    units: nmile
    valid_min: 1
    valid_max: 250
    _FillValue: -9999
    coverage_content_type: physicalMeasurement
    cell_methods: storm: mean
unlimited dimensions:
current shape = (13380, 360)
filling on
Variable: tokyo_lat
<class 'netCDF4._netCDF4.Variable'>
float32 tokyo_lat(storm, date_time)
    long_name: Latitude (RSMC Tokyo)
    units: degrees_north
    _FillValue: -9999.0
    coverage_content_type: coordinate
    cell_methods: storm: mean
unlimited dimensions:
current shape = (13380, 360)
filling on
Variable: tokyo_lon
<class 'netCDF4._netCDF4.Variable'>
float32 tokyo_lon(storm, date_time)
    long_name: Longitude (RSMC Tokyo)
    units: degrees_east
    _FillValue: -9999.0
    coverage_content_type: coordinate
    cell_methods: storm: mean
unlimited dimensions:
current shape = (13380, 360)
filling on
Variable: tokyo_grade
<class 'netCDF4._netCDF4.Variable'>
int8 tokyo_grade(storm, date_time)
    long_name: Storm grade
    units: 1
    valid_min: 2
    valid_max: 9
    _FillValue: -15
    flag_values: [2 3 4 5 6 7 8 9]
    flag_names: tropical_depression tropical_storm severe_tropical_storm typhoon extratropical just_entering_JMA_AoR not_used tropical_cyclone_of_TS_intensity_or_higher
    coverage_content_type: thematicClassification
    cell_methods: storm: mean
unlimited dimensions:
current shape = (13380, 360)
filling on
Variable: tokyo_wind
<class 'netCDF4._netCDF4.Variable'>
int16 tokyo_wind(storm, date_time)
    long_name: Maximum sustained wind speed
    units: kts
    valid_min: 1
    valid_max: 250
    _FillValue: -9999
    coverage_content_type: physicalMeasurement
    cell_methods: storm: mean
unlimited dimensions:
current shape = (13380, 360)
filling on
Variable: tokyo_pres
<class 'netCDF4._netCDF4.Variable'>
int16 tokyo_pres(storm, date_time)
    long_name: Minimum central pressure
    units: mb
    valid_min: 700
    valid_max: 1050
    _FillValue: -9999
    coverage_content_type: physicalMeasurement
    cell_methods: storm: mean
unlimited dimensions:
current shape = (13380, 360)
filling on
Variable: tokyo_r50_dir
<class 'netCDF4._netCDF4.Variable'>
int8 tokyo_r50_dir(storm, date_time)
    long_name: Direction of maximum radius of 50 knots winds
    valid_min: 0
    valid_max: 9
    _FillValue: -15
    flag_values: [1 2 3 4 5 6 7 8 9]
    flag_names: Northeast East Southeast South Southwest West Northwest North Symmetric_Circle
    coverage_content_type: thematicClassification
    cell_methods: storm: mean
unlimited dimensions:
current shape = (13380, 360)
filling on
Variable: tokyo_r50_long
<class 'netCDF4._netCDF4.Variable'>
int16 tokyo_r50_long(storm, date_time)
    long_name: Maximum radius of 50 knots winds
    units: nmile
    valid_min: 1
    valid_max: 1000
    _FillValue: -9999
    coverage_content_type: physicalMeasurement
    cell_methods: storm: mean
unlimited dimensions:
current shape = (13380, 360)
filling on
Variable: tokyo_r50_short
<class 'netCDF4._netCDF4.Variable'>
int16 tokyo_r50_short(storm, date_time)
    long_name: Minimum radius of 50 knots winds
    units: nmile
    valid_min: 1
    valid_max: 1000
    _FillValue: -9999
    coverage_content_type: physicalMeasurement
    cell_methods: storm: mean
unlimited dimensions:
current shape = (13380, 360)
filling on
Variable: tokyo_r30_dir
<class 'netCDF4._netCDF4.Variable'>
int8 tokyo_r30_dir(storm, date_time)
    long_name: Direction of maximum radius of 30 knots winds
    valid_min: 0
    valid_max: 9
    _FillValue: -15
    flag_values: [1 2 3 4 5 6 7 8 9]
    flag_names: Northeast East Southeast South Southwest West Northwest North Symmetric_Circle
    coverage_content_type: thematicClassification
    cell_methods: storm: mean
unlimited dimensions:
current shape = (13380, 360)
filling on
Variable: tokyo_r30_long
<class 'netCDF4._netCDF4.Variable'>
int16 tokyo_r30_long(storm, date_time)
    long_name: Maximum radius of 30 knots winds
    units: nmile
    valid_min: 1
    valid_max: 1000
    _FillValue: -9999
    coverage_content_type: physicalMeasurement
    cell_methods: storm: mean
unlimited dimensions:
current shape = (13380, 360)
filling on
Variable: tokyo_r30_short
<class 'netCDF4._netCDF4.Variable'>
int16 tokyo_r30_short(storm, date_time)
    long_name: Minimum radius of 30 knots winds
    units: nmile
    valid_min: 1
    valid_max: 1000
    _FillValue: -9999
    coverage_content_type: physicalMeasurement
    cell_methods: storm: mean
unlimited dimensions:
current shape = (13380, 360)
filling on
Variable: tokyo_land
<class 'netCDF4._netCDF4.Variable'>
int8 tokyo_land(storm, date_time)
    long_name: Landfall flag
    units: 1
    valid_min: 0
    valid_max: 1
    _FillValue: -15
    coverage_content_type: thematicClassification
    cell_methods: storm: mean
unlimited dimensions:
current shape = (13380, 360)
filling on
Variable: cma_lat
<class 'netCDF4._netCDF4.Variable'>
float32 cma_lat(storm, date_time)
    long_name: Latitude (Chinese Met. Admin.)
    units: degrees_north
    _FillValue: -9999.0
    coverage_content_type: coordinate
    cell_methods: storm: mean
unlimited dimensions:
current shape = (13380, 360)
filling on
Variable: cma_lon
<class 'netCDF4._netCDF4.Variable'>
float32 cma_lon(storm, date_time)
    long_name: Longitude (Chinese Met. Admin.)
    units: degrees_east
    _FillValue: -9999.0
    coverage_content_type: coordinate
    cell_methods: storm: mean
unlimited dimensions:
current shape = (13380, 360)
filling on
Variable: cma_cat
<class 'netCDF4._netCDF4.Variable'>
int8 cma_cat(storm, date_time)
    long_name: Storm category
    units: 1
    valid_min: 0
    valid_max: 9
    _FillValue: -15
    flag_values: [0 1 2 3 4 5 6 9]
    flag_names: weaker_than_tropical_depression_or_unknown tropical_depression tropical_storm severe_tropical_storm typhoon severe_typhoon super_typhoon extratrpoical
    coverage_content_type: thematicClassification
    cell_methods: storm: mean
unlimited dimensions:
current shape = (13380, 360)
filling on
Variable: cma_wind
<class 'netCDF4._netCDF4.Variable'>
int16 cma_wind(storm, date_time)
    long_name: Maximum sustained wind speed
    units: kts
    valid_min: 1
    valid_max: 250
    _FillValue: -9999
    coverage_content_type: physicalMeasurement
    cell_methods: storm: mean
unlimited dimensions:
current shape = (13380, 360)
filling on
Variable: cma_pres
<class 'netCDF4._netCDF4.Variable'>
int16 cma_pres(storm, date_time)
    long_name: Minimum central pressure
    units: mb
    valid_min: 700
    valid_max: 1050
    _FillValue: -9999
    coverage_content_type: physicalMeasurement
    cell_methods: storm: mean
unlimited dimensions:
current shape = (13380, 360)
filling on
Variable: hko_lat
<class 'netCDF4._netCDF4.Variable'>
float32 hko_lat(storm, date_time)
    long_name: Latitude (Hong Kong Observatory)
    units: degrees_north
    _FillValue: -9999.0
    coverage_content_type: coordinate
    cell_methods: storm: mean
unlimited dimensions:
current shape = (13380, 360)
filling on
Variable: hko_lon
<class 'netCDF4._netCDF4.Variable'>
float32 hko_lon(storm, date_time)
    long_name: Longitude (Hong Kong Observatory)
    units: degrees_east
    _FillValue: -9999.0
    coverage_content_type: coordinate
    cell_methods: storm: mean
unlimited dimensions:
current shape = (13380, 360)
filling on
Variable: hko_cat
<class 'netCDF4._netCDF4.Variable'>
|S1 hko_cat(storm, date_time, char6)
    long_name: Storm category
    Note: Even though HKO changed the category meanings in 2009. We have made all systems (including before 2009) consistent with the latest definitions
    coverage_content_type: thematicClassification
    cell_methods: storm: mean
unlimited dimensions:
current shape = (13380, 360, 6)
filling on, default _FillValue of used
Variable: hko_wind
<class 'netCDF4._netCDF4.Variable'>
int16 hko_wind(storm, date_time)
    long_name: Maximum sustained wind speed
    units: kts
    valid_min: 1
    valid_max: 250
    _FillValue: -9999
    coverage_content_type: physicalMeasurement
    cell_methods: storm: mean
unlimited dimensions:
current shape = (13380, 360)
filling on
Variable: hko_pres
<class 'netCDF4._netCDF4.Variable'>
int16 hko_pres(storm, date_time)
    long_name: Minimum central pressure
    units: mb
    valid_min: 700
    valid_max: 1050
    _FillValue: -9999
    coverage_content_type: physicalMeasurement
    cell_methods: storm: mean
unlimited dimensions:
current shape = (13380, 360)
filling on
Variable: kma_lat
<class 'netCDF4._netCDF4.Variable'>
float32 kma_lat(storm, date_time)
    long_name: Latitude (KMA)
    units: degrees_north
    _FillValue: -9999.0
    coverage_content_type: coordinate
    cell_methods: storm: mean
unlimited dimensions:
current shape = (13380, 360)
filling on
Variable: kma_lon
<class 'netCDF4._netCDF4.Variable'>
float32 kma_lon(storm, date_time)
    long_name: Longitude (KMA)
    units: degrees_east
    _FillValue: -9999.0
    coverage_content_type: coordinate
    cell_methods: storm: mean
unlimited dimensions:
current shape = (13380, 360)
filling on
Variable: kma_cat
<class 'netCDF4._netCDF4.Variable'>
|S1 kma_cat(storm, date_time, char3)
    long_name: Storm category
    coverage_content_type: thematicClassification
    cell_methods: storm: mean
unlimited dimensions:
current shape = (13380, 360, 3)
filling on, default _FillValue of used
Variable: kma_wind
<class 'netCDF4._netCDF4.Variable'>
int16 kma_wind(storm, date_time)
    long_name: Maximum sustained wind speed
    units: kts
    valid_min: 1
    valid_max: 250
    _FillValue: -9999
    coverage_content_type: physicalMeasurement
    cell_methods: storm: mean
unlimited dimensions:
current shape = (13380, 360)
filling on
Variable: kma_pres
<class 'netCDF4._netCDF4.Variable'>
int16 kma_pres(storm, date_time)
    long_name: Minimum central pressure
    units: mb
    valid_min: 700
    valid_max: 1050
    _FillValue: -9999
    coverage_content_type: physicalMeasurement
    cell_methods: storm: mean
unlimited dimensions:
current shape = (13380, 360)
filling on
Variable: kma_r50_dir
<class 'netCDF4._netCDF4.Variable'>
float32 kma_r50_dir(storm, date_time)
    long_name: Direction of minimum radius of 25 m/s winds
    valid_min: 0
    valid_max: 360
    _FillValue: -9999.0
    coverage_content_type: physicalMeasurement
    cell_methods: storm: mean
unlimited dimensions:
current shape = (13380, 360)
filling on
Variable: kma_r50_long
<class 'netCDF4._netCDF4.Variable'>
int16 kma_r50_long(storm, date_time)
    long_name: Maximum radius of 25 m/s winds
    units: nmile
    valid_min: 1
    valid_max: 1000
    _FillValue: -9999
    coverage_content_type: physicalMeasurement
    cell_methods: storm: mean
unlimited dimensions:
current shape = (13380, 360)
filling on
Variable: kma_r50_short
<class 'netCDF4._netCDF4.Variable'>
int16 kma_r50_short(storm, date_time)
    long_name: Minimum radius of 25 m/s winds
    units: nmile
    valid_min: 1
    valid_max: 1000
    _FillValue: -9999
    coverage_content_type: physicalMeasurement
    cell_methods: storm: mean
unlimited dimensions:
current shape = (13380, 360)
filling on
Variable: kma_r30_dir
<class 'netCDF4._netCDF4.Variable'>
float32 kma_r30_dir(storm, date_time)
    long_name: Direction of minimum radius of 15 m/s winds
    valid_min: 0
    valid_max: 360
    _FillValue: -9999.0
    coverage_content_type: thematicClassification
    cell_methods: storm: mean
unlimited dimensions:
current shape = (13380, 360)
filling on
Variable: kma_r30_long
<class 'netCDF4._netCDF4.Variable'>
int16 kma_r30_long(storm, date_time)
    long_name: Maximum radius of 15 m/s winds
    units: nmile
    valid_min: 1
    valid_max: 1000
    _FillValue: -9999
    coverage_content_type: physicalMeasurement
    cell_methods: storm: mean
unlimited dimensions:
current shape = (13380, 360)
filling on
Variable: kma_r30_short
<class 'netCDF4._netCDF4.Variable'>
int16 kma_r30_short(storm, date_time)
    long_name: Minimum radius of 15 m/s winds
    units: nmile
    valid_min: 1
    valid_max: 1000
    _FillValue: -9999
    coverage_content_type: physicalMeasurement
    cell_methods: storm: mean
unlimited dimensions:
current shape = (13380, 360)
filling on
Variable: newdelhi_lat
<class 'netCDF4._netCDF4.Variable'>
float32 newdelhi_lat(storm, date_time)
    long_name: Latitude (RSMC New Delhi)
    units: degrees_north
    _FillValue: -9999.0
    coverage_content_type: coordinate
    cell_methods: storm: mean
unlimited dimensions:
current shape = (13380, 360)
filling on
Variable: newdelhi_lon
<class 'netCDF4._netCDF4.Variable'>
float32 newdelhi_lon(storm, date_time)
    long_name: Longitude (RSMC New Delhi)
    units: degrees_east
    _FillValue: -9999.0
    coverage_content_type: coordinate
    cell_methods: storm: mean
unlimited dimensions:
current shape = (13380, 360)
filling on
Variable: newdelhi_grade
<class 'netCDF4._netCDF4.Variable'>
|S1 newdelhi_grade(storm, date_time, char10)
    long_name: Storm grade
    coverage_content_type: thematicClassification
    cell_methods: storm: mean
unlimited dimensions:
current shape = (13380, 360, 10)
filling on, default _FillValue of used
Variable: newdelhi_wind
<class 'netCDF4._netCDF4.Variable'>
int16 newdelhi_wind(storm, date_time)
    long_name: Maximum sustained wind speed
    units: kts
    valid_min: 1
    valid_max: 250
    _FillValue: -9999
    coverage_content_type: physicalMeasurement
    cell_methods: storm: mean
unlimited dimensions:
current shape = (13380, 360)
filling on
Variable: newdelhi_pres
<class 'netCDF4._netCDF4.Variable'>
int16 newdelhi_pres(storm, date_time)
    long_name: Minimum central pressure
    units: mb
    valid_min: 700
    valid_max: 1050
    _FillValue: -9999
    coverage_content_type: physicalMeasurement
    cell_methods: storm: mean
unlimited dimensions:
current shape = (13380, 360)
filling on
Variable: newdelhi_ci
<class 'netCDF4._netCDF4.Variable'>
int16 newdelhi_ci(storm, date_time)
    long_name: Dvorak current intensity (RWMC New Delhi)
    standard_name: dvorak_tropical_cyclone_current_intensity_number
    units: 1
    scale_factor: 0.1
    valid_min: 0.0
    valid_max: 8.0
    _FillValue: -9999
    coverage_content_type: thematicClassification
    cell_methods: storm: mean
unlimited dimensions:
current shape = (13380, 360)
filling on
Variable: newdelhi_dp
<class 'netCDF4._netCDF4.Variable'>
int16 newdelhi_dp(storm, date_time)
    long_name: Storm pressure drop
    units: mb
    valid_min: 1
    valid_max: 250
    _FillValue: -9999
    coverage_content_type: physicalMeasurement
    cell_methods: storm: mean
unlimited dimensions:
current shape = (13380, 360)
filling on
Variable: newdelhi_poci
<class 'netCDF4._netCDF4.Variable'>
int16 newdelhi_poci(storm, date_time)
    long_name: Pressure of outermost closed isobar
    units: mb
    valid_min: 900
    valid_max: 1050
    _FillValue: -9999
    coverage_content_type: physicalMeasurement
    cell_methods: storm: mean
unlimited dimensions:
current shape = (13380, 360)
filling on
Variable: reunion_lat
<class 'netCDF4._netCDF4.Variable'>
float32 reunion_lat(storm, date_time)
    long_name: Latitude (RSMC La Reunion)
    units: degrees_north
    _FillValue: -9999.0
    coverage_content_type: coordinate
    cell_methods: storm: mean
unlimited dimensions:
current shape = (13380, 360)
filling on
Variable: reunion_lon
<class 'netCDF4._netCDF4.Variable'>
float32 reunion_lon(storm, date_time)
    long_name: Longitude (RSMC La Reunion)
    units: degrees_east
    _FillValue: -9999.0
    coverage_content_type: coordinate
    cell_methods: storm: mean
unlimited dimensions:
current shape = (13380, 360)
filling on
Variable: reunion_type
<class 'netCDF4._netCDF4.Variable'>
int8 reunion_type(storm, date_time)
    long_name: Storm type
    valid_min: 1
    valid_max: 9
    _FillValue: -15
    flag_values: [1 2 3 4 5 6 7 8 9]
    flag_names: tropical_disturbance tropical_depression_winds_less_than_34 tropical_storm_winds_34_to_63 tropical_cyclone_winds_64_or_more extratropical dissipating subtropical_cyclone overland unknown
    coverage_content_type: thematicClassification
    cell_methods: storm: mean
unlimited dimensions:
current shape = (13380, 360)
filling on
Variable: reunion_wind
<class 'netCDF4._netCDF4.Variable'>
int16 reunion_wind(storm, date_time)
    long_name: Maximum sustained wind speed
    units: kts
    valid_min: 1
    valid_max: 250
    _FillValue: -9999
    coverage_content_type: physicalMeasurement
    cell_methods: storm: mean
unlimited dimensions:
current shape = (13380, 360)
filling on
Variable: reunion_pres
<class 'netCDF4._netCDF4.Variable'>
int16 reunion_pres(storm, date_time)
    long_name: Minimum central pressure
    units: mb
    valid_min: 700
    valid_max: 1050
    _FillValue: -9999
    coverage_content_type: physicalMeasurement
    cell_methods: storm: mean
unlimited dimensions:
current shape = (13380, 360)
filling on
Variable: reunion_tnum
<class 'netCDF4._netCDF4.Variable'>
int16 reunion_tnum(storm, date_time)
    long_name: Dvorak T number
    units: 1
    scale_factor: 0.1
    valid_min: 0.0
    valid_max: 8.0
    _FillValue: -9999
    coverage_content_type: thematicClassification
    cell_methods: storm: mean
unlimited dimensions:
current shape = (13380, 360)
filling on
Variable: reunion_ci
<class 'netCDF4._netCDF4.Variable'>
int16 reunion_ci(storm, date_time)
    long_name: Dvorak Current Intensity (CI)
    standard_name: dvorak_tropical_cyclone_current_intensity_number
    units: 1
    scale_factor: 0.1
    valid_min: 0.0
    valid_max: 8.0
    _FillValue: -9999
    coverage_content_type: thematicClassification
    cell_methods: storm: mean
unlimited dimensions:
current shape = (13380, 360)
filling on
Variable: reunion_rmw
<class 'netCDF4._netCDF4.Variable'>
int16 reunion_rmw(storm, date_time)
    long_name: Radius of maximum winds
    standard_name: radius_of_tropical_cyclone_maximum_sustained_wind_speed
    units: nmile
    valid_min: 1
    valid_max: 250
    _FillValue: -9999
    coverage_content_type: physicalMeasurement
    cell_methods: storm: mean
unlimited dimensions:
current shape = (13380, 360)
filling on
Variable: reunion_r34
<class 'netCDF4._netCDF4.Variable'>
int16 reunion_r34(storm, date_time, quadrant)
    long_name: Radius of 34 knot winds (storm force)
    units: nmile
    valid_min: 1
    valid_max: 5500
    _FillValue: -9999
    coverage_content_type: physicalMeasurement
    cell_methods: storm: mean
unlimited dimensions:
current shape = (13380, 360, 4)
filling on
Variable: reunion_r50
<class 'netCDF4._netCDF4.Variable'>
int16 reunion_r50(storm, date_time, quadrant)
    long_name: Radius of 50 knot winds (gale force)
    units: nmile
    valid_min: 1
    valid_max: 5500
    _FillValue: -9999
    coverage_content_type: physicalMeasurement
    cell_methods: storm: mean
unlimited dimensions:
current shape = (13380, 360, 4)
filling on
Variable: reunion_r64
<class 'netCDF4._netCDF4.Variable'>
int16 reunion_r64(storm, date_time, quadrant)
    long_name: Radius of 64 knot winds (hurricane force)
    units: nmile
    valid_min: 1
    valid_max: 5500
    _FillValue: -9999
    coverage_content_type: physicalMeasurement
    cell_methods: storm: mean
unlimited dimensions:
current shape = (13380, 360, 4)
filling on
Variable: bom_lat
<class 'netCDF4._netCDF4.Variable'>
float32 bom_lat(storm, date_time)
    long_name: Latitude (Australian BoM)
    units: degrees_north
    _FillValue: -9999.0
    coverage_content_type: coordinate
    cell_methods: storm: mean
unlimited dimensions:
current shape = (13380, 360)
filling on
Variable: bom_lon
<class 'netCDF4._netCDF4.Variable'>
float32 bom_lon(storm, date_time)
    long_name: Longitude (Australian BoM)
    units: degrees_east
    _FillValue: -9999.0
    coverage_content_type: coordinate
    cell_methods: storm: mean
unlimited dimensions:
current shape = (13380, 360)
filling on
Variable: bom_type
<class 'netCDF4._netCDF4.Variable'>
int8 bom_type(storm, date_time)
    long_name: Cyclone type
    valid_min: 10
    valid_max: 91
    _FillValue: -15
    flag_values: [10 20 21 30 40 50 51 52 60 70 71 72 80 81 91]
    flag_names: tropics_disturbance_no_closed_isobar tropical_depression_wind_lt_34_and_1_closed_isobar tropical_storm_wind_34_to_63_in_1_or_2_quadrants tropical_storm_wind_34_to_63_in_3_or_4_quadrants wind_gt_63_knots extratropical_no_gales extratropical_with_gales extratropical_wind_unknown dissipating_no_gales subtropical_cyclone_no_gales subtropical_cyclone_with_gales subtropical_cyclone_wind_unknown overland_no_gales overland_with_gales tropical_cold_cored_monsoon_low
    coverage_content_type: thematicClassification
    cell_methods: storm: mean
unlimited dimensions:
current shape = (13380, 360)
filling on
Variable: bom_wind
<class 'netCDF4._netCDF4.Variable'>
int16 bom_wind(storm, date_time)
    long_name: Maximum sustained wind speed
    units: kts
    valid_min: 1
    valid_max: 250
    _FillValue: -9999
    coverage_content_type: physicalMeasurement
    cell_methods: storm: mean
unlimited dimensions:
current shape = (13380, 360)
filling on
Variable: bom_pres
<class 'netCDF4._netCDF4.Variable'>
int16 bom_pres(storm, date_time)
    long_name: Minimum central pressure
    units: mb
    valid_min: 700
    valid_max: 1050
    _FillValue: -9999
    coverage_content_type: physicalMeasurement
    cell_methods: storm: mean
unlimited dimensions:
current shape = (13380, 360)
filling on
Variable: bom_tnum
<class 'netCDF4._netCDF4.Variable'>
int16 bom_tnum(storm, date_time)
    long_name: Dvorak T number
    units: 1
    scale_factor: 0.1
    valid_min: 0.0
    valid_max: 8.0
    _FillValue: -9999
    coverage_content_type: thematicClassification
    cell_methods: storm: mean
unlimited dimensions:
current shape = (13380, 360)
filling on
Variable: bom_ci
<class 'netCDF4._netCDF4.Variable'>
int16 bom_ci(storm, date_time)
    long_name: Dvorak Current Intensity (CI)
    standard_name: dvorak_tropical_cyclone_current_intensity_number
    units: 1
    scale_factor: 0.1
    valid_min: 0.0
    valid_max: 8.0
    _FillValue: -9999
    coverage_content_type: thematicClassification
    cell_methods: storm: mean
unlimited dimensions:
current shape = (13380, 360)
filling on
Variable: bom_rmw
<class 'netCDF4._netCDF4.Variable'>
int16 bom_rmw(storm, date_time)
    long_name: Radius of maximum winds
    standard_name: radius_of_tropical_cyclone_maximum_sustained_wind_speed
    units: nmile
    valid_min: 1
    valid_max: 1000
    _FillValue: -9999
    coverage_content_type: physicalMeasurement
    cell_methods: storm: mean
unlimited dimensions:
current shape = (13380, 360)
filling on
Variable: bom_r34
<class 'netCDF4._netCDF4.Variable'>
int16 bom_r34(storm, date_time, quadrant)
    long_name: Radius of 34 knot winds (storm force)
    units: nmile
    valid_min: 1
    valid_max: 2000
    _FillValue: -9999
    coverage_content_type: physicalMeasurement
    cell_methods: storm: mean
unlimited dimensions:
current shape = (13380, 360, 4)
filling on
Variable: bom_r50
<class 'netCDF4._netCDF4.Variable'>
int16 bom_r50(storm, date_time, quadrant)
    long_name: Radius of 50 knot winds (gale force)
    units: nmile
    valid_min: 1
    valid_max: 2000
    _FillValue: -9999
    coverage_content_type: physicalMeasurement
    cell_methods: storm: mean
unlimited dimensions:
current shape = (13380, 360, 4)
filling on
Variable: bom_r64
<class 'netCDF4._netCDF4.Variable'>
int16 bom_r64(storm, date_time, quadrant)
    long_name: Radius of 64 knot winds (hurricane force)
    units: nmile
    valid_min: 1
    valid_max: 2000
    _FillValue: -9999
    coverage_content_type: physicalMeasurement
    cell_methods: storm: mean
unlimited dimensions:
current shape = (13380, 360, 4)
filling on
Variable: bom_roci
<class 'netCDF4._netCDF4.Variable'>
int16 bom_roci(storm, date_time)
    long_name: Radius of outermost closed isobar
    units: nmile
    valid_min: 1
    valid_max: 2000
    _FillValue: -9999
    coverage_content_type: physicalMeasurement
    cell_methods: storm: mean
unlimited dimensions:
current shape = (13380, 360)
filling on
Variable: bom_poci
<class 'netCDF4._netCDF4.Variable'>
int16 bom_poci(storm, date_time)
    long_name: Environmental pressure
    units: mb
    valid_min: 900
    valid_max: 1050
    _FillValue: -9999
    coverage_content_type: physicalMeasurement
    cell_methods: storm: mean
unlimited dimensions:
current shape = (13380, 360)
filling on
Variable: bom_eye
<class 'netCDF4._netCDF4.Variable'>
int16 bom_eye(storm, date_time)
    long_name: Eye diameter
    standard_name: radius_of_tropical_cyclone_eye
    units: nmile
    valid_min: 1
    valid_max: 200
    _FillValue: -9999
    coverage_content_type: physicalMeasurement
    cell_methods: storm: mean
unlimited dimensions:
current shape = (13380, 360)
filling on
Variable: bom_pos_method
<class 'netCDF4._netCDF4.Variable'>
int8 bom_pos_method(storm, date_time)
    long_name: Method used to derive position
    _FillValue: -15
    flag_values: [ 1  2  3  4  5  6  7  8 10 11 12 13]
    flag_names: no_sat_no_radar_no_obs no_sat_no_radar_obs_only sat_ir_vis_no_clear_eye sat_ir_vis_clearly_defined_eye aircraft_radar_report landbased_radar_report sat_ir_vis_and_radar_and_obs report_inside_eye sat_scatterometer sat_microwave manned_aircraft_recon UAV_aircraft_recon
    coverage_content_type: qualityInformation
    cell_methods: storm: mean
unlimited dimensions:
current shape = (13380, 360)
filling on
Variable: bom_pres_method
<class 'netCDF4._netCDF4.Variable'>
int8 bom_pres_method(storm, date_time)
    long_name: Method used to derive intensity
    _FillValue: -15
    flag_values: [1 2 3 4 5 6 7 8 9]
    flag_names: aircraft_or_dropsonde over_wat_obs over_land_obs instrument_unknown_type derived_Dvorak derived_from_wind_W_P_relationship estimate_from_surrounding_obs extrapolation_from_radar other
    coverage_content_type: qualityInformation
    cell_methods: storm: mean
unlimited dimensions:
current shape = (13380, 360)
filling on
Variable: nadi_lat
<class 'netCDF4._netCDF4.Variable'>
float32 nadi_lat(storm, date_time)
    long_name: Latitude (RSMC Fiji)
    units: degrees_north
    _FillValue: -9999.0
    coverage_content_type: coordinate
    cell_methods: storm: mean
unlimited dimensions:
current shape = (13380, 360)
filling on
Variable: nadi_lon
<class 'netCDF4._netCDF4.Variable'>
float32 nadi_lon(storm, date_time)
    long_name: Longitude (RSMC Fiji)
    units: degrees_east
    _FillValue: -9999.0
    coverage_content_type: coordinate
    cell_methods: storm: mean
unlimited dimensions:
current shape = (13380, 360)
filling on
Variable: nadi_cat
<class 'netCDF4._netCDF4.Variable'>
int8 nadi_cat(storm, date_time)
    long_name: Storm category
    units: 1
    _FillValue: -15
    coverage_content_type: thematicClassification
    cell_methods: storm: mean
unlimited dimensions:
current shape = (13380, 360)
filling on
Variable: nadi_wind
<class 'netCDF4._netCDF4.Variable'>
int16 nadi_wind(storm, date_time)
    long_name: Maximum sustained wind speed
    units: kts
    valid_min: 1
    valid_max: 250
    _FillValue: -9999
    coverage_content_type: physicalMeasurement
    cell_methods: storm: mean
unlimited dimensions:
current shape = (13380, 360)
filling on
Variable: nadi_pres
<class 'netCDF4._netCDF4.Variable'>
int16 nadi_pres(storm, date_time)
    long_name: Minimum central pressure
    units: mb
    valid_min: 700
    valid_max: 1050
    _FillValue: -9999
    coverage_content_type: physicalMeasurement
    cell_methods: storm: mean
unlimited dimensions:
current shape = (13380, 360)
filling on
Variable: wellington_lat
<class 'netCDF4._netCDF4.Variable'>
float32 wellington_lat(storm, date_time)
    long_name: Latitude (RSMC Wellington)
    units: degrees_north
    _FillValue: -9999.0
    coverage_content_type: coordinate
    cell_methods: storm: mean
unlimited dimensions:
current shape = (13380, 360)
filling on
Variable: wellington_lon
<class 'netCDF4._netCDF4.Variable'>
float32 wellington_lon(storm, date_time)
    long_name: Longitude (RSMC Wellington)
    units: degrees_east
    _FillValue: -9999.0
    coverage_content_type: coordinate
    cell_methods: storm: mean
unlimited dimensions:
current shape = (13380, 360)
filling on
Variable: wellington_wind
<class 'netCDF4._netCDF4.Variable'>
int16 wellington_wind(storm, date_time)
    long_name: Maximum sustained wind speed
    units: kts
    valid_min: 1
    valid_max: 250
    _FillValue: -9999
    coverage_content_type: physicalMeasurement
    cell_methods: storm: mean
unlimited dimensions:
current shape = (13380, 360)
filling on
Variable: wellington_pres
<class 'netCDF4._netCDF4.Variable'>
int16 wellington_pres(storm, date_time)
    long_name: Minimum central pressure
    units: mb
    valid_min: 700
    valid_max: 1050
    _FillValue: -9999
    coverage_content_type: physicalMeasurement
    cell_methods: storm: mean
unlimited dimensions:
current shape = (13380, 360)
filling on
Variable: ds824_lat
<class 'netCDF4._netCDF4.Variable'>
float32 ds824_lat(storm, date_time)
    long_name: Latitude (DS824 dataset)
    units: degrees_north
    _FillValue: -9999.0
    coverage_content_type: coordinate
    cell_methods: storm: mean
unlimited dimensions:
current shape = (13380, 360)
filling on
Variable: ds824_lon
<class 'netCDF4._netCDF4.Variable'>
float32 ds824_lon(storm, date_time)
    long_name: Longitude (DS824 dataset)
    units: degrees_east
    _FillValue: -9999.0
    coverage_content_type: coordinate
    cell_methods: storm: mean
unlimited dimensions:
current shape = (13380, 360)
filling on
Variable: ds824_stage
<class 'netCDF4._netCDF4.Variable'>
|S1 ds824_stage(storm, date_time, char2)
    long_name: Storm classification
    coverage_content_type: thematicClassification
    cell_methods: storm: mean
unlimited dimensions:
current shape = (13380, 360, 2)
filling on, default _FillValue of used
Variable: ds824_wind
<class 'netCDF4._netCDF4.Variable'>
int16 ds824_wind(storm, date_time)
    long_name: Maximum sustained wind speed
    standard_name: tropical_cyclone_maximum_sustained_wind_speed
    units: kts
    valid_min: 1
    valid_max: 250
    _FillValue: -9999
    coverage_content_type: physicalMeasurement
    cell_methods: storm: mean
unlimited dimensions:
current shape = (13380, 360)
filling on
Variable: ds824_pres
<class 'netCDF4._netCDF4.Variable'>
int16 ds824_pres(storm, date_time)
    long_name: Minimum central pressure
    units: mb
    valid_min: 700
    valid_max: 1050
    _FillValue: -9999
    coverage_content_type: physicalMeasurement
    cell_methods: storm: mean
unlimited dimensions:
current shape = (13380, 360)
filling on
Variable: td9636_lat
<class 'netCDF4._netCDF4.Variable'>
float32 td9636_lat(storm, date_time)
    long_name: Latitude (TD-9636 dataset)
    units: degrees_north
    _FillValue: -9999.0
    coverage_content_type: coordinate
    cell_methods: storm: mean
unlimited dimensions:
current shape = (13380, 360)
filling on
Variable: td9636_lon
<class 'netCDF4._netCDF4.Variable'>
float32 td9636_lon(storm, date_time)
    long_name: Longitude (TD-9636 dataset)
    units: degrees_east
    _FillValue: -9999.0
    coverage_content_type: coordinate
    cell_methods: storm: mean
unlimited dimensions:
current shape = (13380, 360)
filling on
Variable: td9636_stage
<class 'netCDF4._netCDF4.Variable'>
int8 td9636_stage(storm, date_time)
    long_name: Storm classification
    valid_min: 0
    valid_max: 7
    _FillValue: -15
    flag_values: [0 1 2 3 4 5 6 7]
    flag_names: tropical_disturbance tropical_depression tropical_storm point_where_wind_reached_64_knots hurricane extratropical disspiating unknown_intensity_or_doubtful_track
    Note: Winds referred to in the stages differs for the North Indian. The Hurricane category means Wind > 48 knots and flag=3 means when wind reached that intensity
    coverage_content_type: thematicClassification
    cell_methods: storm: mean
unlimited dimensions:
current shape = (13380, 360)
filling on
Variable: td9636_wind
<class 'netCDF4._netCDF4.Variable'>
int16 td9636_wind(storm, date_time)
    long_name: Maximum sustained wind speed
    standard_name: tropical_cyclone_maximum_sustained_wind_speed
    units: kts
    valid_min: 1
    valid_max: 250
    _FillValue: -9999
    coverage_content_type: physicalMeasurement
    cell_methods: storm: mean
unlimited dimensions:
current shape = (13380, 360)
filling on
Variable: td9636_pres
<class 'netCDF4._netCDF4.Variable'>
int16 td9636_pres(storm, date_time)
    long_name: Minimum central pressure
    units: mb
    valid_min: 700
    valid_max: 1050
    _FillValue: -9999
    coverage_content_type: physicalMeasurement
    cell_methods: storm: mean
unlimited dimensions:
current shape = (13380, 360)
filling on
Variable: td9635_lat
<class 'netCDF4._netCDF4.Variable'>
float32 td9635_lat(storm, date_time)
    long_name: Latitude (TD-9635 dataset)
    units: degrees_north
    _FillValue: -9999.0
    coverage_content_type: coordinate
    cell_methods: storm: mean
unlimited dimensions:
current shape = (13380, 360)
filling on
Variable: td9635_lon
<class 'netCDF4._netCDF4.Variable'>
float32 td9635_lon(storm, date_time)
    long_name: Longitude (TD-9635 dataset)
    units: degrees_east
    _FillValue: -9999.0
    coverage_content_type: coordinate
    cell_methods: storm: mean
unlimited dimensions:
current shape = (13380, 360)
filling on
Variable: td9635_wind
<class 'netCDF4._netCDF4.Variable'>
int16 td9635_wind(storm, date_time)
    long_name: Maximum sustained wind speed
    standard_name: tropical_cyclone_maximum_sustained_wind_speed
    units: kts
    valid_min: 1
    valid_max: 250
    _FillValue: -9999
    coverage_content_type: physicalMeasurement
    cell_methods: storm: mean
unlimited dimensions:
current shape = (13380, 360)
filling on
Variable: td9635_pres
<class 'netCDF4._netCDF4.Variable'>
int16 td9635_pres(storm, date_time)
    long_name: Minimum central pressure
    units: mb
    valid_min: 700
    valid_max: 1050
    _FillValue: -9999
    coverage_content_type: physicalMeasurement
    cell_methods: storm: mean
unlimited dimensions:
current shape = (13380, 360)
filling on
Variable: td9635_roci
<class 'netCDF4._netCDF4.Variable'>
int16 td9635_roci(storm, date_time)
    long_name: Radius of outermost closed isober
    units: nmile
    valid_min: 1
    valid_max: 2999
    _FillValue: -9999
    coverage_content_type: physicalMeasurement
    cell_methods: storm: mean
unlimited dimensions:
current shape = (13380, 360)
filling on
Variable: neumann_lat
<class 'netCDF4._netCDF4.Variable'>
float32 neumann_lat(storm, date_time)
    long_name: Latitude (Neumann dataset)
    units: degrees_north
    _FillValue: -9999.0
    coverage_content_type: coordinate
    cell_methods: storm: mean
unlimited dimensions:
current shape = (13380, 360)
filling on
Variable: neumann_lon
<class 'netCDF4._netCDF4.Variable'>
float32 neumann_lon(storm, date_time)
    long_name: Longitude (Neumann dataset)
    units: degrees_east
    _FillValue: -9999.0
    coverage_content_type: coordinate
    cell_methods: storm: mean
unlimited dimensions:
current shape = (13380, 360)
filling on
Variable: neumann_class
<class 'netCDF4._netCDF4.Variable'>
|S1 neumann_class(storm, date_time, char2)
    long_name: Storm classification
    coverage_content_type: thematicClassification
    cell_methods: storm: mean
unlimited dimensions:
current shape = (13380, 360, 2)
filling on, default _FillValue of used
Variable: neumann_wind
<class 'netCDF4._netCDF4.Variable'>
int16 neumann_wind(storm, date_time)
    long_name: Maximum sustained wind speed
    standard_name: tropical_cyclone_maximum_sustained_wind_speed
    units: kts
    valid_min: 1
    valid_max: 250
    _FillValue: -9999
    coverage_content_type: physicalMeasurement
    cell_methods: storm: mean
unlimited dimensions:
current shape = (13380, 360)
filling on
Variable: neumann_pres
<class 'netCDF4._netCDF4.Variable'>
int16 neumann_pres(storm, date_time)
    long_name: Minimum central pressure
    units: mb
    valid_min: 700
    valid_max: 1050
    _FillValue: -9999
    coverage_content_type: physicalMeasurement
    cell_methods: storm: mean
unlimited dimensions:
current shape = (13380, 360)
filling on
Variable: mlc_lat
<class 'netCDF4._netCDF4.Variable'>
float32 mlc_lat(storm, date_time)
    long_name: Latitude (M. L. Chenoweth dataset)
    units: degrees_north
    _FillValue: -9999.0
    coverage_content_type: coordinate
    cell_methods: storm: mean
unlimited dimensions:
current shape = (13380, 360)
filling on
Variable: mlc_lon
<class 'netCDF4._netCDF4.Variable'>
float32 mlc_lon(storm, date_time)
    long_name: Longitude (M. L. Chenoweth dataset)
    units: degrees_east
    _FillValue: -9999.0
    coverage_content_type: coordinate
    cell_methods: storm: mean
unlimited dimensions:
current shape = (13380, 360)
filling on
Variable: mlc_class
<class 'netCDF4._netCDF4.Variable'>
|S1 mlc_class(storm, date_time, char2)
    long_name: Storm classification
    coverage_content_type: thematicClassification
    cell_methods: storm: mean
unlimited dimensions:
current shape = (13380, 360, 2)
filling on, default _FillValue of used
Variable: mlc_wind
<class 'netCDF4._netCDF4.Variable'>
int16 mlc_wind(storm, date_time)
    long_name: Maximum sustained wind speed
    standard_name: tropical_cyclone_maximum_sustained_wind_speed
    units: kts
    valid_min: 1
    valid_max: 250
    _FillValue: -9999
    coverage_content_type: physicalMeasurement
    cell_methods: storm: mean
unlimited dimensions:
current shape = (13380, 360)
filling on
Variable: mlc_pres
<class 'netCDF4._netCDF4.Variable'>
int16 mlc_pres(storm, date_time)
    long_name: Minimum central pressure
    units: mb
    valid_min: 700
    valid_max: 1050
    _FillValue: -9999
    coverage_content_type: physicalMeasurement
    cell_methods: storm: mean
unlimited dimensions:
current shape = (13380, 360)
filling on
Variable: usa_gust
<class 'netCDF4._netCDF4.Variable'>
int16 usa_gust(storm, date_time)
    long_name: Maximum reported wind gust from a US agency
    standard_name: wind_speed_of_gust
    units: kts
    valid_min: 1
    valid_max: 350
    _FillValue: -9999
    coordinates: time lon lat
    coverage_content_type: physicalMeasurement
    cell_methods: storm: mean
unlimited dimensions:
current shape = (13380, 360)
filling on
Variable: bom_gust
<class 'netCDF4._netCDF4.Variable'>
int16 bom_gust(storm, date_time)
    long_name: Maximum reported wind gust from BoM
    standard_name: wind_speed_of_gust
    units: kts
    valid_min: 1
    valid_max: 350
    _FillValue: -9999
    coordinates: time lon lat
    coverage_content_type: physicalMeasurement
    cell_methods: storm: mean
unlimited dimensions:
current shape = (13380, 360)
filling on
Variable: bom_gust_per
<class 'netCDF4._netCDF4.Variable'>
int16 bom_gust_per(storm, date_time)
    long_name: Time period of the wind gust from BoM
    units: second
    valid_min: 1
    valid_max: 9999
    _FillValue: -9999
    coordinates: time lon lat
    coverage_content_type: physicalMeasurement
    cell_methods: storm: mean
unlimited dimensions:
current shape = (13380, 360)
filling on
Variable: reunion_gust
<class 'netCDF4._netCDF4.Variable'>
int16 reunion_gust(storm, date_time)
    long_name: Maximum reported wind gust from Reunion
    standard_name: wind_speed_of_gust
    units: kts
    valid_min: 1
    valid_max: 350
    _FillValue: -9999
    coordinates: time lon lat
    coverage_content_type: physicalMeasurement
    cell_methods: storm: mean
unlimited dimensions:
current shape = (13380, 360)
filling on
Variable: reunion_gust_per
<class 'netCDF4._netCDF4.Variable'>
int16 reunion_gust_per(storm, date_time)
    long_name: Time period of the wind gust from Reunion
    units: second
    valid_min: 1
    valid_max: 9999
    _FillValue: -9999
    coordinates: time lon lat
    coverage_content_type: physicalMeasurement
    cell_methods: storm: mean
unlimited dimensions:
current shape = (13380, 360)
filling on
Variable: usa_seahgt
<class 'netCDF4._netCDF4.Variable'>
int16 usa_seahgt(storm, date_time)
    long_name: Wave height for given radii
    units: ft
    valid_min: 1
    valid_max: 998
    _FillValue: -9999
    coverage_content_type: physicalMeasurement
    cell_methods: storm: mean
unlimited dimensions:
current shape = (13380, 360)
filling on
Variable: usa_searad
<class 'netCDF4._netCDF4.Variable'>
int16 usa_searad(storm, date_time, quadrant)
    long_name: Radial extent of given sea height
    units: nmile
    valid_min: 1
    valid_max: 998
    _FillValue: -9999
    coverage_content_type: physicalMeasurement
    cell_methods: storm: mean
unlimited dimensions:
current shape = (13380, 360, 4)
filling on
Variable: storm_speed
<class 'netCDF4._netCDF4.Variable'>
int16 storm_speed(storm, date_time)
    long_name: Storm translation speed
    units: kts
    valid_min: 0
    valid_max: 998
    _FillValue: -9999
    coverage_content_type: physicalMeasurement
    cell_methods: storm: mean
unlimited dimensions:
current shape = (13380, 360)
filling on
Variable: storm_dir
<class 'netCDF4._netCDF4.Variable'>
int16 storm_dir(storm, date_time)
    long_name: Storm translation direction
    units: degrees
    valid_min: 0
    valid_max: 360
    _FillValue: -9999
    Note: Unit is degrees east of north
    coverage_content_type: physicalMeasurement
    cell_methods: storm: mean
unlimited dimensions:
current shape = (13380, 360)
filling on
# Access the relevant variables from the NetCDF file
storm_ids = nc_file.variables['sid'][:]
latitudes = nc_file.variables['lat'][:]
longitudes = nc_file.variables['lon'][:]
wmo_wind = nc_file.variables['wmo_wind'][:]
wmo_pres = nc_file.variables['wmo_pres'][:]
times = nc_file.variables['time'][:]

# Convert storm IDs to strings
storm_ids = [''.join(sid.astype(str)).strip() for sid in storm_ids]

# Identify unique storm IDs in the dataset
unique_storm_ids = set(storm_ids)
print(f"Unique Storm IDs: {list(unique_storm_ids)[:10]}")  # Display the first 10 unique storm IDs
Unique Storm IDs: ['1947168N11132', '1999348N12115', '1923024N09138', '2015009S19054', '2022355S10128', '1920284N14134', '1870211N28272', '1971032S15137', '1970078S11098', '1967259N17145']
Selecting and Verifying a Specific Storm#
Next, we select a specific storm ID for further analysis and verify if it is present in the dataset.
# Target a specific storm ID for analysis
target_sid = '2012166N09269'  # Example: using the first unique storm ID
print(f"Target SID: {target_sid}")

# Verify if the target SID is present in the dataset
if target_sid in storm_ids:
    print(f"Storm ID {target_sid} found in the dataset.")
else:
    print(f"Storm ID {target_sid} not found in the dataset.")
    exit()  # Exit if the target SID is not found
Target SID: 2012166N09269
Storm ID 2012166N09269 found in the dataset.
Handling Missing Data and Extracting Storm Data#
We then check for any missing data in the latitudes and longitudes and extract the relevant data points for the selected storm.
# Check for missing data in latitudes and longitudes
print(f"NaN in latitudes: {np.isnan(latitudes).any()}")
print(f"NaN in longitudes: {np.isnan(longitudes).any()}")

# Identify the indices corresponding to the target storm ID
storm_indices = np.where(np.array(storm_ids) == target_sid)[0]
print(f"Storm indices for {target_sid}: {storm_indices}")

# Extract relevant data for the selected storm
filtered_lats = latitudes[storm_indices].flatten()
filtered_lons = longitudes[storm_indices].flatten()
filtered_winds = wmo_wind[storm_indices].flatten()
filtered_pressures = wmo_pres[storm_indices].flatten()
filtered_times = times[storm_indices].flatten()
NaN in latitudes: False
NaN in longitudes: False
Storm indices for 2012166N09269: [12099]
Filtering and Visualizing the Storm Track#
Finally, we filter the data to remove any invalid points and visualize the storm’s path on a map.
# Filter valid data points, removing any with NaN values or invalid measurements
valid_data = [(lat, lon, wind, pres, t) for lat, lon, wind, pres, t in zip(filtered_lats, filtered_lons, filtered_winds, filtered_pressures, filtered_times) if not np.isnan(lat) and not np.isnan(lon) and wind != -9999 and pres != -9999]

if valid_data:
    filtered_lats, filtered_lons, filtered_winds, filtered_pressures, filtered_times = zip(*valid_data)

    # Create a base map centered on the mean latitude and longitude
    m = folium.Map(location=[np.mean(filtered_lats), np.mean(filtered_lons)], zoom_start=5)

    # Add the storm track to the map
    for lat, lon in zip(filtered_lats, filtered_lons):
        folium.CircleMarker(
            location=[lat, lon],
            radius=5,
            color='blue',
            fill=True,
            fill_color='blue',
            fill_opacity=0.6
        ).add_to(m)

    # Add a polyline to connect the storm's path
    coordinates = list(zip(filtered_lats, filtered_lons))
    folium.PolyLine(locations=coordinates, color='blue').add_to(m)

    # Display the map in the notebook
    display(m)
else:
    print("No valid data points to plot.")
Visualizing Storm Data Over Time: Wind Speed and Pressure#
In this section, we’ll take our analysis a step further by visualizing how key storm metrics—specifically wind speed and pressure—change over time. Understanding these time-based dynamics is crucial for interpreting the storm’s behavior and its potential impacts.
We’ll start by converting the time data, which is stored in Julian days, into standard calendar dates. This will make our time series easier to understand and interpret. After that, we’ll create a dual-axis plot to simultaneously visualize the changes in wind speed and pressure as the storm progresses. This plot will help us observe any correlations or patterns between these two variables during the storm’s lifecycle.
import matplotlib.pyplot as plt

from datetime import datetime, timedelta

# Convert Julian days to calendar dates
start_date = datetime(1858, 11, 17)  # Julian day zero reference
filtered_dates = [start_date + timedelta(days=t) for t in filtered_times]
import matplotlib.pyplot as plt

# Create the figure and axis objects
fig, ax1 = plt.subplots(figsize=(10, 6))

# Plot the wind speed on the left y-axis
ax1.plot(filtered_dates, filtered_winds, color='blue')
ax1.set_xlabel('Date')
ax1.set_ylabel('Wind Speed (kts)', color='blue')
ax1.tick_params(axis='y', labelcolor='blue')

# Create a second y-axis to plot the pressure
ax2 = ax1.twinx()
ax2.plot(filtered_dates, filtered_pressures, color='red')
ax2.set_ylabel('Pressure (mb)', color='red')
ax2.tick_params(axis='y', labelcolor='red')

# Improve layout and add a title
plt.title(f'Time Series for Storm {target_sid}', fontsize=14)
fig.tight_layout()

# Display the plot
plt.show()